

Vancouver, WA
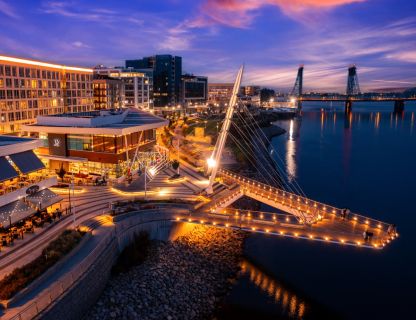
Strategically located at the intersection of I-5 and the Columbia River, Vancouver is exceptionally positioned to reach major West Coast, Midwest and international markets. A rapidly-growing city, Vancouver combines the excitement of a major metropolitan area with small-town charm and abundant recreational opportunities. Vancouver’s newly-developed waterfront is a regional destination with restaurants, wine bars and residential and office towers. Vancouver employers have access to a labor pool of nearly two million workers within a 30-mile radius, as well as an ample supply of development-ready land, competitive lease rates, abundant clean water and low utility rates. Vancouver's business-friendly tax environment (no corporate or personal state income taxes) continues to attract pioneering companies such as Zoominfo and Absci. Learn more here.
Population
Population
| Population | 2000 | 2010 | 2025 | 2030 |
|---|---|---|---|---|
| Vancouver, WA | 148,066 | 167,217 | 201,170 | 211,307 |
Source: ESRI, 2025-08-25
Population by Age
| Population | 2025 |
|---|---|
| 0-4 | 10,803 |
| 5-9 | 11,195 |
| 10-14 | 11,283 |
| 15-19 | 11,710 |
| 20-24 | 12,467 |
| 25-29 | 14,869 |
| 30-34 | 15,703 |
| 35-39 | 14,938 |
| 40-44 | 14,081 |
| 45-49 | 12,523 |
| 50-54 | 11,976 |
| 55-59 | 11,031 |
| 60-64 | 10,944 |
| 65-69 | 10,821 |
| 70-74 | 9,932 |
| 75-79 | 7,835 |
| 80-84 | 4,840 |
| 85+ | 4,219 |
| 18+ | 160,911 |
| Median Age | 39 |
Source: ESRI, 2025-08-25
Population by Race
| Vancouver, WA | 2025 |
|---|---|
| Total | 201,170.00 |
| White Alone | 66.23% |
| Black Alone | 3.64% |
| American Indian Alone | 1.28% |
| Asian Alone | 6.34% |
| Pacific Islander Alone | 2.13% |
| Some Other Race | 8.01% |
| Two or More Races | 12.37% |
| Hispanic Origin | 17.38% |
| Diversity Index | 66.80 |
Source: ESRI, 2025-08-25
Growth Rate
| Vancouver, WA | 2025 - 2030 |
|---|---|
| Population | 0.99% |
| Households | 1.22% |
| Families | 1.14% |
| Median Household Income | 2% |
| Per Capita Income | 2% |
Source: ESRI, 2025-08-25
Housing
Households
| Population | 2000 | 2010 | 2025 | 2030 |
|---|---|---|---|---|
| Households | 58,255 | 68,041 | 83,918 | 89,153 |
| Housing Units | 61,727 | 72,498 | 88,359 | 93,792 |
| Owner Occupied Units | 41,131 | 44,264 | ||
| Renter Occupied Units | 42,787 | 44,889 | ||
| Vacant Units | 4,441 | 4,639 |
Source: ESRI, 2025-08-25
Home Value
| Vancouver, WA | 2025 | 2030 |
|---|---|---|
| Median Home Value | $547,425 | $640,573 |
| Average Home Value | $605,070 | $724,546 |
| <$50,000 | 994 | 585 |
| $50,000 - $99,999 | 390 | 299 |
| $100,000 - $149,999 | 379 | 107 |
| $150,000 - $199,999 | 542 | 180 |
| $200,000 - $249,999 | 704 | 186 |
| $250,000 - $299,999 | 783 | 246 |
| $300,000 - $399,999 | 3,720 | 1,769 |
| $400,000 - $499,999 | 10,069 | 7,820 |
| $500,000 - $749,999 | 15,696 | 19,441 |
| $1,000,000 + | 1,549 | 2,711 |
Source: ESRI, 2025-08-25
Housing Year Built
| Year Range | Houses Built |
|---|---|
| 2010 or Later | 8,992 |
| 2000-2009 | 10,808 |
| 1990-1999 | 18,054 |
| 1980-1989 | 10,060 |
| 1970-1979 | 15,274 |
| 1960-1969 | 6,397 |
| 1950-1959 | 4,588 |
| 1940-1949 | 3,864 |
| 1939 or Before | 4,275 |
Source: ESRI, 2025-08-25
Back To TopIncome
Income
| Vancouver, WA | 2025 | 2030 |
|---|---|---|
| Median Household | $82,774 | $92,218 |
| Average Household | $107,850 | $119,783 |
| Per Capita | $45,025 | $50,571 |
Source: ESRI, 2025-08-25
Household Income
| Vancouver, WA | 2025 |
|---|---|
| <$15,000 | 5,340 |
| $15,000 - $24,999 | 4,552 |
| $25,000 - $34,999 | 5,065 |
| $35,000 - $49,999 | 7,728 |
| $50,000 - $74,999 | 14,487 |
| $75,000 - $99,999 | 12,636 |
| $100,000 - $149,999 | 16,801 |
| $150,000 - $199,999 | 8,320 |
| $200,000+ | 8,989 |
Source: ESRI, 2025-08-25
Back To TopEmployees
Commute
| Category | Commuters |
|---|---|
| Workers 16+ | 94,036 |
| In-County Residents | 66,886 |
| Out-of-County Residents | 1,705 |
| Drive Alone | 65,334 |
| Carpooled | 8,894 |
| Public Transport | 1,785 |
| Work at Home | 14,437 |
| Motorcycle | 197 |
| Bicycle | 433 |
| Walked | 1,912 |
| Other | 934 |
| Less than 5 minutes | 1,831 |
| 5-9 minutes | 7,753 |
| 10-14 minutes | 12,460 |
| 15-19 minutes | 16,706 |
| 20-24 minutes | 12,501 |
| 25-29 minutes | 5,117 |
| 30-34 minutes | 10,047 |
| 35-39 minutes | 1,940 |
| 40-44 minutes | 2,323 |
| 45-59 minutes | 4,765 |
| 60-89 minutes | 2,660 |
| 90+ minutes | 1,494 |
| Average Travel Time | 0 |
Source: ESRI, 2025-08-25
Source: ESRI, 2025-08-25
Employees by NAICS
| Category | Number |
|---|---|
| Total Employees | 96,348 |
| Agr/Forestry/Fish/Hunt | 126 |
| Mining | 31 |
| Utilities | 67 |
| Construction | 4,852 |
| Manufacturing | 7,902 |
| Wholesale Trade | 4,116 |
| Retail Trade | 10,778 |
| Motor Veh/Parts Dealers | 1,430 |
| Furn & Home Furnish Str | 142 |
| Electronics & Appl Store | 114 |
| Bldg Matl/Garden Equip | 918 |
| Food & Beverage Stores | 2,853 |
| Health/Pers Care Stores | 715 |
| Gasoline Stations | 457 |
| Clothing/Accessory Store | 502 |
| Sports/Hobby/Book/Music | 1,256 |
| General Merchandise Str | 2,391 |
| Transportation/Warehouse | 2,761 |
| Information | 3,379 |
| Finance & Insurance | 3,007 |
| Cntrl Bank/Crdt Intrmdtn | 1,274 |
| Sec/Cmdty Cntrct/Oth Inv | 917 |
| Insur/Funds/Trusts/Other | 816 |
| Real Estate/Rent/Leasing | 4,260 |
| Prof/Scientific/Tech Srv | 5,813 |
| Legal Services | 1,125 |
| Mgmt of Comp/Enterprises | 96 |
| Admin/Support/Waste Mgmt | 2,819 |
| Educational Services | 10,704 |
| HealthCare/Social Assist | 16,093 |
| Arts/Entertainment/Rec | 1,235 |
| Accommodation/Food Srvcs | 8,378 |
| Accommodation | 888 |
| Food Srv/Drinking Places | 7,490 |
| Other Srv excl Pub Admin | 5,561 |
| Auto Repair/Maintenance | 825 |
| Public Administration Emp | 4,306 |
Source: ESRI, 2025-08-25
Educational Attainment (25+)
| Vancouver, WA | 2025 |
|---|---|
| <9th Grade | 3,559 |
| Some High School | 8,088 |
| GED | 6,496 |
| Graduated High School | 29,744 |
| Some College/No Degree | 31,098 |
| Associates Degree | 15,511 |
| Bachelor's Degree | 30,928 |
| Graduate Degree | 18,288 |
Source: ESRI, 2025-08-25
Back To TopBusinesses
Businesses by NAICS
| Category | Number |
|---|---|
| Total Businesses | 7,826 |
| Agr/Forestry/Fish/Hunt Bus | 14 |
| Mining Bus | 3 |
| Utilities Bus | 6 |
| Construction Bus | 621 |
| Manufacturing Bus | 287 |
| Wholesale Trade Bus | 213 |
| Retail Trade Bus | 851 |
| Motor Veh/Parts Dealers Bus | 86 |
| Furn & Home Furnish Str Bus | 36 |
| Electronics & Appl Store Bus | 29 |
| Bldg Matl/Garden Equip Bus | 91 |
| Food & Beverage Stores Bus | 127 |
| Health/Pers Care Stores Bus | 101 |
| Gasoline Stations Bus | 66 |
| Clothing/Accessory Store Bus | 70 |
| Sports/Hobby/Book/Music Bus | 166 |
| General Merchandise Str Bus | 79 |
| Transportation/Warehouse Bus | 167 |
| Information Bus | 159 |
| Finance & Insurance Bus | 488 |
| Cntrl Bank/Crdt Intrmdtn Bus | 190 |
| Sec/Cmdty Cntrct/Oth Inv Bus | 167 |
| Insur/Funds/Trusts/Other Bus | 131 |
| Real Estate/Rent/Leasing Bus | 569 |
| Prof/Scientific/Tech Srv Bus | 842 |
| Legal Services Bus | 223 |
| Mgmt of Comp/Enterprises Bus | 17 |
| Admin/Support/Waste Mgmt Bus | 259 |
| Educational Services Bus | 191 |
| HealthCare/Social Assist Bus | 1,091 |
| Arts/Entertainment/Rec Bus | 136 |
| Accommodation/Food Srvcs Bus | 588 |
| Accommodation Bus | 51 |
| Food Srv/Drinking Places Bus | 537 |
| Other Srv excl Pub Admin Bus | 942 |
| Auto Repair/Maintenance Bus | 128 |
| Public Administration Bus | 129 |
Source: ESRI, 2025-08-25
Back To Top