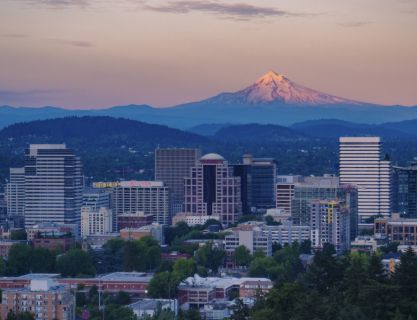
Portland, OR
Portland, Oregon’s largest city, sits on the Columbia and Willamette rivers, in the shadow of snow-capped Mount Hood. Its industry strengths encompass athletic & outdoor, technology, manufacturing, and green city services and technologies. Its remarkable transportation options include the nationally ranked PDX airport, light rail and bike/walk alternatives. The region’s airports, marine properties and business parks are integral to the area’s economy. The city attracts both businesses and young, well-educated talent drawn by Portland’s green spaces, eco-friendliness, microbreweries and coffeehouses, cultural amenities, year-round recreational access and opportunities for growth. Learn more here.
Population
Population
| Population | 2000 | 2010 | 2025 | 2030 |
|---|---|---|---|---|
| Portland, OR | 529,018 | 583,763 | 664,411 | 674,387 |
Source: ESRI, 2025-08-25
Population by Age
| Population | 2025 |
|---|---|
| 0-4 | 28,329 |
| 5-9 | 30,035 |
| 10-14 | 30,540 |
| 15-19 | 32,836 |
| 20-24 | 43,789 |
| 25-29 | 55,352 |
| 30-34 | 65,142 |
| 35-39 | 60,906 |
| 40-44 | 56,918 |
| 45-49 | 47,203 |
| 50-54 | 42,103 |
| 55-59 | 35,872 |
| 60-64 | 32,726 |
| 65-69 | 31,779 |
| 70-74 | 28,657 |
| 75-79 | 20,870 |
| 80-84 | 11,700 |
| 85+ | 9,654 |
| 18+ | 557,019 |
| Median Age | 39 |
Source: ESRI, 2025-08-25
Population by Race
| Portland, OR | 2025 |
|---|---|
| Total | 664,411.00 |
| White Alone | 66.8% |
| Black Alone | 6.14% |
| American Indian Alone | 1.15% |
| Asian Alone | 8.53% |
| Pacific Islander Alone | 0.64% |
| Some Other Race | 5.26% |
| Two or More Races | 11.49% |
| Hispanic Origin | 12.12% |
| Diversity Index | 62.70 |
Source: ESRI, 2025-08-25
Growth Rate
| Portland, OR | 2025 - 2030 |
|---|---|
| Population | 0.30% |
| Households | 0.27% |
| Families | 0.03% |
| Median Household Income | 3% |
| Per Capita Income | 3% |
Source: ESRI, 2025-08-25
Housing
Households
| Population | 2000 | 2010 | 2025 | 2030 |
|---|---|---|---|---|
| Households | 223,686 | 248,546 | 286,688 | 290,577 |
| Housing Units | 237,240 | 265,441 | 311,150 | 316,935 |
| Owner Occupied Units | 142,559 | 143,969 | ||
| Renter Occupied Units | 144,129 | 146,608 | ||
| Vacant Units | 24,462 | 26,358 |
Source: ESRI, 2025-08-25
Home Value
| Portland, OR | 2025 | 2030 |
|---|---|---|
| Median Home Value | $633,785 | $698,206 |
| Average Home Value | $689,009 | $766,754 |
| <$50,000 | 1,534 | 586 |
| $50,000 - $99,999 | 756 | 308 |
| $100,000 - $149,999 | 573 | 133 |
| $150,000 - $199,999 | 476 | 58 |
| $200,000 - $249,999 | 1,084 | 184 |
| $250,000 - $299,999 | 1,197 | 236 |
| $300,000 - $399,999 | 7,421 | 2,625 |
| $400,000 - $499,999 | 24,968 | 16,652 |
| $500,000 - $749,999 | 62,121 | 64,549 |
| $1,000,000 + | 10,355 | 15,198 |
Source: ESRI, 2025-08-25
Housing Year Built
| Year Range | Houses Built |
|---|---|
| 2010 or Later | 33,508 |
| 2000-2009 | 30,189 |
| 1990-1999 | 22,344 |
| 1980-1989 | 19,449 |
| 1970-1979 | 31,890 |
| 1960-1969 | 25,506 |
| 1950-1959 | 33,585 |
| 1940-1949 | 22,047 |
| 1939 or Before | 82,420 |
Source: ESRI, 2025-08-25
Back To TopIncome
Income
| Portland, OR | 2025 | 2030 |
|---|---|---|
| Median Household | $93,530 | $109,802 |
| Average Household | $131,324 | $148,855 |
| Per Capita | $56,805 | $64,276 |
Source: ESRI, 2025-08-25
Household Income
| Portland, OR | 2025 |
|---|---|
| <$15,000 | 25,515 |
| $15,000 - $24,999 | 15,621 |
| $25,000 - $34,999 | 15,259 |
| $35,000 - $49,999 | 23,361 |
| $50,000 - $74,999 | 37,588 |
| $75,000 - $99,999 | 33,059 |
| $100,000 - $149,999 | 49,833 |
| $150,000 - $199,999 | 31,180 |
| $200,000+ | 55,272 |
Source: ESRI, 2025-08-25
Back To TopEmployees
Commute
| Category | Commuters |
|---|---|
| Workers 16+ | 357,779 |
| In-County Residents | 296,357 |
| Out-of-County Residents | 51,201 |
| Drive Alone | 180,365 |
| Carpooled | 25,078 |
| Public Transport | 26,149 |
| Work at Home | 90,576 |
| Motorcycle | 604 |
| Bicycle | 13,280 |
| Walked | 17,029 |
| Other | 4,156 |
| Less than 5 minutes | 5,399 |
| 5-9 minutes | 19,504 |
| 10-14 minutes | 32,776 |
| 15-19 minutes | 47,438 |
| 20-24 minutes | 49,814 |
| 25-29 minutes | 22,706 |
| 30-34 minutes | 41,674 |
| 35-39 minutes | 8,665 |
| 40-44 minutes | 9,275 |
| 45-59 minutes | 16,149 |
| 60-89 minutes | 9,836 |
| 90+ minutes | 3,966 |
| Average Travel Time | 0 |
Source: ESRI, 2025-08-25
Source: ESRI, 2025-08-25
Employees by NAICS
| Category | Number |
|---|---|
| Total Employees | 494,905 |
| Agr/Forestry/Fish/Hunt | 902 |
| Mining | 227 |
| Utilities | 2,498 |
| Construction | 27,318 |
| Manufacturing | 25,912 |
| Wholesale Trade | 16,322 |
| Retail Trade | 41,009 |
| Motor Veh/Parts Dealers | 4,297 |
| Furn & Home Furnish Str | 1,708 |
| Electronics & Appl Store | 1,123 |
| Bldg Matl/Garden Equip | 4,616 |
| Food & Beverage Stores | 11,779 |
| Health/Pers Care Stores | 3,558 |
| Gasoline Stations | 1,147 |
| Clothing/Accessory Store | 3,284 |
| Sports/Hobby/Book/Music | 5,558 |
| General Merchandise Str | 3,939 |
| Transportation/Warehouse | 15,358 |
| Information | 10,971 |
| Finance & Insurance | 12,859 |
| Cntrl Bank/Crdt Intrmdtn | 3,009 |
| Sec/Cmdty Cntrct/Oth Inv | 3,351 |
| Insur/Funds/Trusts/Other | 6,499 |
| Real Estate/Rent/Leasing | 14,638 |
| Prof/Scientific/Tech Srv | 38,731 |
| Legal Services | 8,105 |
| Mgmt of Comp/Enterprises | 1,194 |
| Admin/Support/Waste Mgmt | 10,761 |
| Educational Services | 34,330 |
| HealthCare/Social Assist | 115,965 |
| Arts/Entertainment/Rec | 9,652 |
| Accommodation/Food Srvcs | 38,576 |
| Accommodation | 7,458 |
| Food Srv/Drinking Places | 31,118 |
| Other Srv excl Pub Admin | 52,653 |
| Auto Repair/Maintenance | 3,293 |
| Public Administration Emp | 24,537 |
Source: ESRI, 2025-08-25
Educational Attainment (25+)
| Portland, OR | 2025 |
|---|---|
| <9th Grade | 11,652 |
| Some High School | 16,566 |
| GED | 16,427 |
| Graduated High School | 55,142 |
| Some College/No Degree | 77,575 |
| Associates Degree | 37,808 |
| Bachelor's Degree | 175,767 |
| Graduate Degree | 107,945 |
Source: ESRI, 2025-08-25
Back To TopBusinesses
Businesses by NAICS
| Category | Number |
|---|---|
| Total Businesses | 35,554 |
| Agr/Forestry/Fish/Hunt Bus | 125 |
| Mining Bus | 18 |
| Utilities Bus | 24 |
| Construction Bus | 1,883 |
| Manufacturing Bus | 1,347 |
| Wholesale Trade Bus | 1,114 |
| Retail Trade Bus | 3,978 |
| Motor Veh/Parts Dealers Bus | 412 |
| Furn & Home Furnish Str Bus | 239 |
| Electronics & Appl Store Bus | 109 |
| Bldg Matl/Garden Equip Bus | 351 |
| Food & Beverage Stores Bus | 718 |
| Health/Pers Care Stores Bus | 246 |
| Gasoline Stations Bus | 138 |
| Clothing/Accessory Store Bus | 429 |
| Sports/Hobby/Book/Music Bus | 981 |
| General Merchandise Str Bus | 355 |
| Transportation/Warehouse Bus | 725 |
| Information Bus | 883 |
| Finance & Insurance Bus | 1,214 |
| Cntrl Bank/Crdt Intrmdtn Bus | 389 |
| Sec/Cmdty Cntrct/Oth Inv Bus | 444 |
| Insur/Funds/Trusts/Other Bus | 381 |
| Real Estate/Rent/Leasing Bus | 2,416 |
| Prof/Scientific/Tech Srv Bus | 4,463 |
| Legal Services Bus | 1,031 |
| Mgmt of Comp/Enterprises Bus | 96 |
| Admin/Support/Waste Mgmt Bus | 1,032 |
| Educational Services Bus | 792 |
| HealthCare/Social Assist Bus | 3,918 |
| Arts/Entertainment/Rec Bus | 829 |
| Accommodation/Food Srvcs Bus | 3,407 |
| Accommodation Bus | 281 |
| Food Srv/Drinking Places Bus | 3,126 |
| Other Srv excl Pub Admin Bus | 4,228 |
| Auto Repair/Maintenance Bus | 521 |
| Public Administration Bus | 556 |
Source: ESRI, 2025-08-25
Back To Top

