

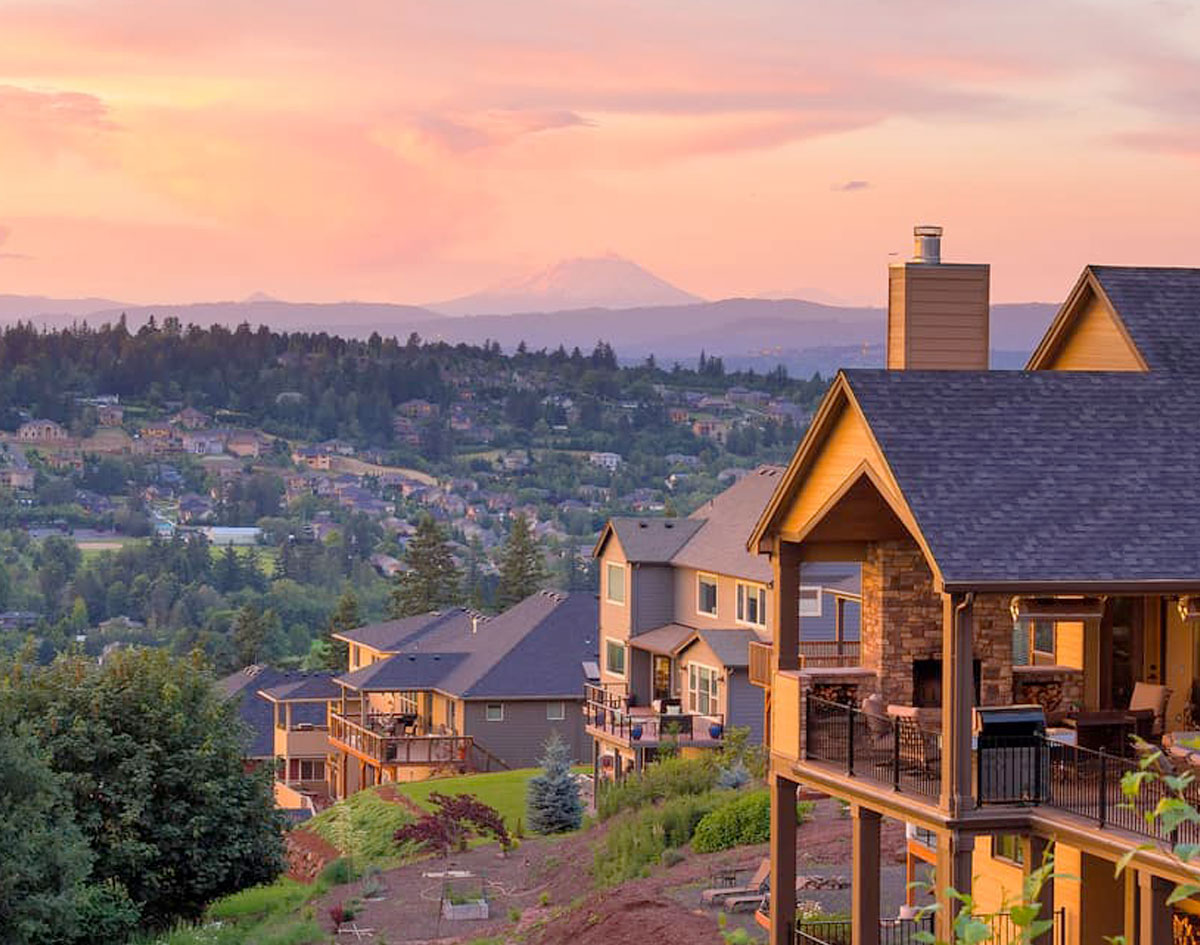
Happy Valley, OR
Is your business growing? It’s an exciting time that requires strategic decisions. Come join a growing city and be part of something bigger. Happy Valley believes in partnerships with the business community, and offers an opportunity to build a city where family-friendly neighborhoods meet a world-class economy. Advantageously located less than 15 miles southeast of downtown Portland, 12 miles from Portland International Airport, and near major freeways and highways, including I-205 and Highway 26, Happy Valley is an ideal location for businesses with regional or far-reaching aspirations. Living in Happy Valley means a high quality of life. Learn more here.
Population
Population
| Population | 2000 | 2010 | 2025 | 2030 |
|---|---|---|---|---|
| Happy Valley, OR | 8,476 | 15,633 | 28,620 | 29,530 |
Source: ESRI, 2025-08-25
Population by Age
| Population | 2025 |
|---|---|
| 0-4 | 1,649 |
| 5-9 | 1,896 |
| 10-14 | 2,143 |
| 15-19 | 2,055 |
| 20-24 | 1,564 |
| 25-29 | 1,719 |
| 30-34 | 1,720 |
| 35-39 | 1,904 |
| 40-44 | 2,147 |
| 45-49 | 2,157 |
| 50-54 | 2,014 |
| 55-59 | 1,785 |
| 60-64 | 1,616 |
| 65-69 | 1,353 |
| 70-74 | 1,200 |
| 75-79 | 840 |
| 80-84 | 508 |
| 85+ | 350 |
| 18+ | 21,590 |
| Median Age | 39 |
Source: ESRI, 2025-08-25
Population by Race
| Happy Valley, OR | 2025 |
|---|---|
| Total | 28,620.00 |
| White Alone | 64.12% |
| Black Alone | 2.12% |
| American Indian Alone | 0.5% |
| Asian Alone | 20.8% |
| Pacific Islander Alone | 0.28% |
| Some Other Race | 2.58% |
| Two or More Races | 9.6% |
| Hispanic Origin | 7.60% |
| Diversity Index | 60.10 |
Source: ESRI, 2025-08-25
Growth Rate
| Happy Valley, OR | 2025 - 2030 |
|---|---|
| Population | 0.63% |
| Households | 0.82% |
| Families | 0.88% |
| Median Household Income | 4% |
| Per Capita Income | 3% |
Source: ESRI, 2025-08-25
Housing
Households
| Population | 2000 | 2010 | 2025 | 2030 |
|---|---|---|---|---|
| Households | 2,882 | 5,074 | 9,605 | 10,006 |
| Housing Units | 3,014 | 5,410 | 9,894 | 10,261 |
| Owner Occupied Units | 7,809 | 8,178 | ||
| Renter Occupied Units | 1,796 | 1,828 | ||
| Vacant Units | 289 | 255 |
Source: ESRI, 2025-08-25
Home Value
| Happy Valley, OR | 2025 | 2030 |
|---|---|---|
| Median Home Value | $716,278 | $779,094 |
| Average Home Value | $796,716 | $860,128 |
| <$50,000 | 40 | 12 |
| $50,000 - $99,999 | 8 | 1 |
| $100,000 - $149,999 | 8 | 0 |
| $150,000 - $199,999 | 6 | 0 |
| $200,000 - $249,999 | 4 | 0 |
| $250,000 - $299,999 | 7 | 1 |
| $300,000 - $399,999 | 69 | 20 |
| $400,000 - $499,999 | 591 | 289 |
| $500,000 - $749,999 | 3,666 | 3,432 |
| $1,000,000 + | 770 | 1,103 |
Source: ESRI, 2025-08-25
Housing Year Built
| Year Range | Houses Built |
|---|---|
| 2010 or Later | 2,322 |
| 2000-2009 | 2,323 |
| 1990-1999 | 1,594 |
| 1980-1989 | 639 |
| 1970-1979 | 805 |
| 1960-1969 | 510 |
| 1950-1959 | 215 |
| 1940-1949 | 30 |
| 1939 or Before | 89 |
Source: ESRI, 2025-08-25
Back To TopIncome
Income
| Happy Valley, OR | 2025 | 2030 |
|---|---|---|
| Median Household | $136,929 | $164,817 |
| Average Household | $181,003 | $207,437 |
| Per Capita | $60,769 | $70,311 |
Source: ESRI, 2025-08-25
Household Income
| Happy Valley, OR | 2025 |
|---|---|
| <$15,000 | 192 |
| $15,000 - $24,999 | 105 |
| $25,000 - $34,999 | 283 |
| $35,000 - $49,999 | 502 |
| $50,000 - $74,999 | 1,082 |
| $75,000 - $99,999 | 1,062 |
| $100,000 - $149,999 | 2,056 |
| $150,000 - $199,999 | 1,110 |
| $200,000+ | 3,213 |
Source: ESRI, 2025-08-25
Back To TopEmployees
Commute
| Category | Commuters |
|---|---|
| Workers 16+ | 12,417 |
| In-County Residents | 6,484 |
| Out-of-County Residents | 5,575 |
| Drive Alone | 8,268 |
| Carpooled | 719 |
| Public Transport | 262 |
| Work at Home | 2,574 |
| Motorcycle | 0 |
| Bicycle | 15 |
| Walked | 419 |
| Other | 155 |
| Less than 5 minutes | 247 |
| 5-9 minutes | 875 |
| 10-14 minutes | 1,061 |
| 15-19 minutes | 833 |
| 20-24 minutes | 1,577 |
| 25-29 minutes | 1,135 |
| 30-34 minutes | 1,210 |
| 35-39 minutes | 464 |
| 40-44 minutes | 638 |
| 45-59 minutes | 998 |
| 60-89 minutes | 610 |
| 90+ minutes | 194 |
| Average Travel Time | 0 |
Source: ESRI, 2025-08-25
Source: ESRI, 2025-08-25
Employees by NAICS
| Category | Number |
|---|---|
| Total Employees | 4,845 |
| Agr/Forestry/Fish/Hunt | 31 |
| Mining | 3 |
| Utilities | 7 |
| Construction | 195 |
| Manufacturing | 119 |
| Wholesale Trade | 533 |
| Retail Trade | 558 |
| Motor Veh/Parts Dealers | 49 |
| Furn & Home Furnish Str | 34 |
| Electronics & Appl Store | 5 |
| Bldg Matl/Garden Equip | 44 |
| Food & Beverage Stores | 262 |
| Health/Pers Care Stores | 40 |
| Gasoline Stations | 5 |
| Clothing/Accessory Store | 55 |
| Sports/Hobby/Book/Music | 52 |
| General Merchandise Str | 12 |
| Transportation/Warehouse | 64 |
| Information | 70 |
| Finance & Insurance | 88 |
| Cntrl Bank/Crdt Intrmdtn | 52 |
| Sec/Cmdty Cntrct/Oth Inv | 11 |
| Insur/Funds/Trusts/Other | 25 |
| Real Estate/Rent/Leasing | 212 |
| Prof/Scientific/Tech Srv | 210 |
| Legal Services | 13 |
| Mgmt of Comp/Enterprises | 3 |
| Admin/Support/Waste Mgmt | 86 |
| Educational Services | 317 |
| HealthCare/Social Assist | 535 |
| Arts/Entertainment/Rec | 148 |
| Accommodation/Food Srvcs | 787 |
| Accommodation | 2 |
| Food Srv/Drinking Places | 785 |
| Other Srv excl Pub Admin | 388 |
| Auto Repair/Maintenance | 40 |
| Public Administration Emp | 491 |
Source: ESRI, 2025-08-25
Educational Attainment (25+)
| Happy Valley, OR | 2025 |
|---|---|
| <9th Grade | 328 |
| Some High School | 531 |
| GED | 471 |
| Graduated High School | 2,378 |
| Some College/No Degree | 3,457 |
| Associates Degree | 2,895 |
| Bachelor's Degree | 6,385 |
| Graduate Degree | 2,868 |
Source: ESRI, 2025-08-25
Back To TopBusinesses
Businesses by NAICS
| Category | Number |
|---|---|
| Total Businesses | 629 |
| Agr/Forestry/Fish/Hunt Bus | 5 |
| Mining Bus | 1 |
| Utilities Bus | 2 |
| Construction Bus | 59 |
| Manufacturing Bus | 10 |
| Wholesale Trade Bus | 12 |
| Retail Trade Bus | 57 |
| Motor Veh/Parts Dealers Bus | 4 |
| Furn & Home Furnish Str Bus | 7 |
| Electronics & Appl Store Bus | 1 |
| Bldg Matl/Garden Equip Bus | 8 |
| Food & Beverage Stores Bus | 9 |
| Health/Pers Care Stores Bus | 6 |
| Gasoline Stations Bus | 1 |
| Clothing/Accessory Store Bus | 5 |
| Sports/Hobby/Book/Music Bus | 11 |
| General Merchandise Str Bus | 5 |
| Transportation/Warehouse Bus | 10 |
| Information Bus | 12 |
| Finance & Insurance Bus | 27 |
| Cntrl Bank/Crdt Intrmdtn Bus | 11 |
| Sec/Cmdty Cntrct/Oth Inv Bus | 5 |
| Insur/Funds/Trusts/Other Bus | 11 |
| Real Estate/Rent/Leasing Bus | 48 |
| Prof/Scientific/Tech Srv Bus | 83 |
| Legal Services Bus | 4 |
| Mgmt of Comp/Enterprises Bus | 1 |
| Admin/Support/Waste Mgmt Bus | 16 |
| Educational Services Bus | 15 |
| HealthCare/Social Assist Bus | 65 |
| Arts/Entertainment/Rec Bus | 23 |
| Accommodation/Food Srvcs Bus | 67 |
| Accommodation Bus | 1 |
| Food Srv/Drinking Places Bus | 66 |
| Other Srv excl Pub Admin Bus | 76 |
| Auto Repair/Maintenance Bus | 12 |
| Public Administration Bus | 14 |
Source: ESRI, 2025-08-25
Back To Top