

Wilsonville, OR
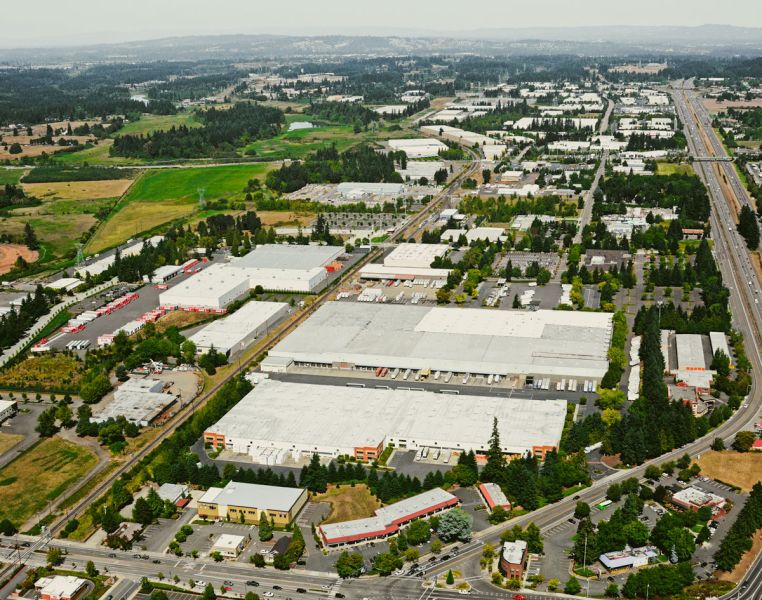
Located at the southernmost end of the Portland metropolitan area, Wilsonville is the gateway to the verdant Willamette Valley. Once a small farming community, Wilsonville is now a thriving mid-size city whose residents enjoy both modern, urban amenities, as well as the small-town charms of "country living" just 17 miles from downtown Portland. Adjacent Interstate 5 and the Willamette River, Wilsonville is a business-friendly community that provides a coveted location. Over half the city's jobs are in family-wage industries: high-tech manufacturing, software engineering and wholesale distribution. The combined Wilsonville payroll exceeds $1 billion. Learn more here.
Population
Population
| Population | 2000 | 2010 | 2025 | 2030 |
|---|---|---|---|---|
| Wilsonville, OR | 14,150 | 19,608 | 27,610 | 28,195 |
Source: ESRI, 2025-08-25
Population by Age
| Population | 2025 |
|---|---|
| 0-4 | 1,462 |
| 5-9 | 1,561 |
| 10-14 | 1,475 |
| 15-19 | 1,511 |
| 20-24 | 1,646 |
| 25-29 | 2,024 |
| 30-34 | 2,372 |
| 35-39 | 2,220 |
| 40-44 | 1,978 |
| 45-49 | 1,625 |
| 50-54 | 1,622 |
| 55-59 | 1,517 |
| 60-64 | 1,446 |
| 65-69 | 1,344 |
| 70-74 | 1,224 |
| 75-79 | 1,071 |
| 80-84 | 785 |
| 85+ | 727 |
| 18+ | 22,179 |
| Median Age | 39 |
Source: ESRI, 2025-08-25
Population by Race
| Wilsonville, OR | 2025 |
|---|---|
| Total | 27,610.00 |
| White Alone | 74.1% |
| Black Alone | 1.82% |
| American Indian Alone | 1.04% |
| Asian Alone | 5.81% |
| Pacific Islander Alone | 0.39% |
| Some Other Race | 6.27% |
| Two or More Races | 10.57% |
| Hispanic Origin | 14.25% |
| Diversity Index | 57.10 |
Source: ESRI, 2025-08-25
Growth Rate
| Wilsonville, OR | 2025 - 2030 |
|---|---|
| Population | 0.42% |
| Households | 0.52% |
| Families | 0.52% |
| Median Household Income | 2% |
| Per Capita Income | 3% |
Source: ESRI, 2025-08-25
Housing
Households
| Population | 2000 | 2010 | 2025 | 2030 |
|---|---|---|---|---|
| Households | 5,984 | 7,893 | 11,023 | 11,314 |
| Housing Units | 6,457 | 8,522 | 11,548 | 11,866 |
| Owner Occupied Units | 5,971 | 6,262 | ||
| Renter Occupied Units | 5,052 | 5,052 | ||
| Vacant Units | 525 | 552 |
Source: ESRI, 2025-08-25
Home Value
| Wilsonville, OR | 2025 | 2030 |
|---|---|---|
| Median Home Value | $652,403 | $690,101 |
| Average Home Value | $711,908 | $768,700 |
| <$50,000 | 39 | 7 |
| $50,000 - $99,999 | 41 | 11 |
| $100,000 - $149,999 | 8 | 0 |
| $150,000 - $199,999 | 28 | 0 |
| $200,000 - $249,999 | 12 | 0 |
| $250,000 - $299,999 | 21 | 2 |
| $300,000 - $399,999 | 95 | 24 |
| $400,000 - $499,999 | 706 | 383 |
| $500,000 - $749,999 | 3,339 | 3,556 |
| $1,000,000 + | 265 | 406 |
Source: ESRI, 2025-08-25
Housing Year Built
| Year Range | Houses Built |
|---|---|
| 2010 or Later | 2,554 |
| 2000-2009 | 2,107 |
| 1990-1999 | 2,629 |
| 1980-1989 | 1,846 |
| 1970-1979 | 1,215 |
| 1960-1969 | 96 |
| 1950-1959 | 53 |
| 1940-1949 | 48 |
| 1939 or Before | 134 |
Source: ESRI, 2025-08-25
Back To TopIncome
Income
| Wilsonville, OR | 2025 | 2030 |
|---|---|---|
| Median Household | $105,454 | $117,398 |
| Average Household | $141,829 | $164,413 |
| Per Capita | $56,814 | $66,161 |
Source: ESRI, 2025-08-25
Household Income
| Wilsonville, OR | 2025 |
|---|---|
| <$15,000 | 573 |
| $15,000 - $24,999 | 360 |
| $25,000 - $34,999 | 396 |
| $35,000 - $49,999 | 832 |
| $50,000 - $74,999 | 1,837 |
| $75,000 - $99,999 | 1,095 |
| $100,000 - $149,999 | 2,702 |
| $150,000 - $199,999 | 1,012 |
| $200,000+ | 2,216 |
Source: ESRI, 2025-08-25
Back To TopEmployees
Commute
| Category | Commuters |
|---|---|
| Workers 16+ | 12,973 |
| In-County Residents | 6,803 |
| Out-of-County Residents | 6,096 |
| Drive Alone | 9,335 |
| Carpooled | 1,454 |
| Public Transport | 176 |
| Work at Home | 1,557 |
| Motorcycle | 11 |
| Bicycle | 34 |
| Walked | 247 |
| Other | 126 |
| Less than 5 minutes | 204 |
| 5-9 minutes | 1,534 |
| 10-14 minutes | 1,069 |
| 15-19 minutes | 1,291 |
| 20-24 minutes | 1,898 |
| 25-29 minutes | 820 |
| 30-34 minutes | 1,723 |
| 35-39 minutes | 428 |
| 40-44 minutes | 869 |
| 45-59 minutes | 1,090 |
| 60-89 minutes | 416 |
| 90+ minutes | 74 |
| Average Travel Time | 25 |
Source: ESRI, 2025-08-25
Source: ESRI, 2025-08-25
Employees by NAICS
| Category | Number |
|---|---|
| Total Employees | 18,592 |
| Agr/Forestry/Fish/Hunt | 13 |
| Mining | 4 |
| Utilities | 23 |
| Construction | 855 |
| Manufacturing | 4,550 |
| Wholesale Trade | 1,710 |
| Retail Trade | 2,326 |
| Motor Veh/Parts Dealers | 514 |
| Furn & Home Furnish Str | 72 |
| Electronics & Appl Store | 20 |
| Bldg Matl/Garden Equip | 496 |
| Food & Beverage Stores | 256 |
| Health/Pers Care Stores | 100 |
| Gasoline Stations | 53 |
| Clothing/Accessory Store | 14 |
| Sports/Hobby/Book/Music | 315 |
| General Merchandise Str | 486 |
| Transportation/Warehouse | 274 |
| Information | 1,131 |
| Finance & Insurance | 188 |
| Cntrl Bank/Crdt Intrmdtn | 101 |
| Sec/Cmdty Cntrct/Oth Inv | 40 |
| Insur/Funds/Trusts/Other | 47 |
| Real Estate/Rent/Leasing | 293 |
| Prof/Scientific/Tech Srv | 1,673 |
| Legal Services | 22 |
| Mgmt of Comp/Enterprises | 5 |
| Admin/Support/Waste Mgmt | 378 |
| Educational Services | 630 |
| HealthCare/Social Assist | 1,149 |
| Arts/Entertainment/Rec | 360 |
| Accommodation/Food Srvcs | 1,146 |
| Accommodation | 211 |
| Food Srv/Drinking Places | 935 |
| Other Srv excl Pub Admin | 656 |
| Auto Repair/Maintenance | 141 |
| Public Administration Emp | 1,221 |
Source: ESRI, 2025-08-25
Educational Attainment (25+)
| Wilsonville, OR | 2025 |
|---|---|
| <9th Grade | 270 |
| Some High School | 493 |
| GED | 943 |
| Graduated High School | 2,826 |
| Some College/No Degree | 3,530 |
| Associates Degree | 1,966 |
| Bachelor's Degree | 6,694 |
| Graduate Degree | 3,233 |
Source: ESRI, 2025-08-25
Back To TopBusinesses
Businesses by NAICS
| Category | Number |
|---|---|
| Total Businesses | 1,127 |
| Agr/Forestry/Fish/Hunt Bus | 5 |
| Mining Bus | 1 |
| Utilities Bus | 2 |
| Construction Bus | 73 |
| Manufacturing Bus | 93 |
| Wholesale Trade Bus | 64 |
| Retail Trade Bus | 134 |
| Motor Veh/Parts Dealers Bus | 21 |
| Furn & Home Furnish Str Bus | 13 |
| Electronics & Appl Store Bus | 2 |
| Bldg Matl/Garden Equip Bus | 21 |
| Food & Beverage Stores Bus | 13 |
| Health/Pers Care Stores Bus | 17 |
| Gasoline Stations Bus | 6 |
| Clothing/Accessory Store Bus | 4 |
| Sports/Hobby/Book/Music Bus | 24 |
| General Merchandise Str Bus | 13 |
| Transportation/Warehouse Bus | 28 |
| Information Bus | 22 |
| Finance & Insurance Bus | 45 |
| Cntrl Bank/Crdt Intrmdtn Bus | 20 |
| Sec/Cmdty Cntrct/Oth Inv Bus | 11 |
| Insur/Funds/Trusts/Other Bus | 14 |
| Real Estate/Rent/Leasing Bus | 69 |
| Prof/Scientific/Tech Srv Bus | 115 |
| Legal Services Bus | 9 |
| Mgmt of Comp/Enterprises Bus | 1 |
| Admin/Support/Waste Mgmt Bus | 30 |
| Educational Services Bus | 21 |
| HealthCare/Social Assist Bus | 102 |
| Arts/Entertainment/Rec Bus | 27 |
| Accommodation/Food Srvcs Bus | 89 |
| Accommodation Bus | 14 |
| Food Srv/Drinking Places Bus | 75 |
| Other Srv excl Pub Admin Bus | 130 |
| Auto Repair/Maintenance Bus | 16 |
| Public Administration Bus | 24 |
Source: ESRI, 2025-08-25
Back To Top