
Lake Oswego, OR
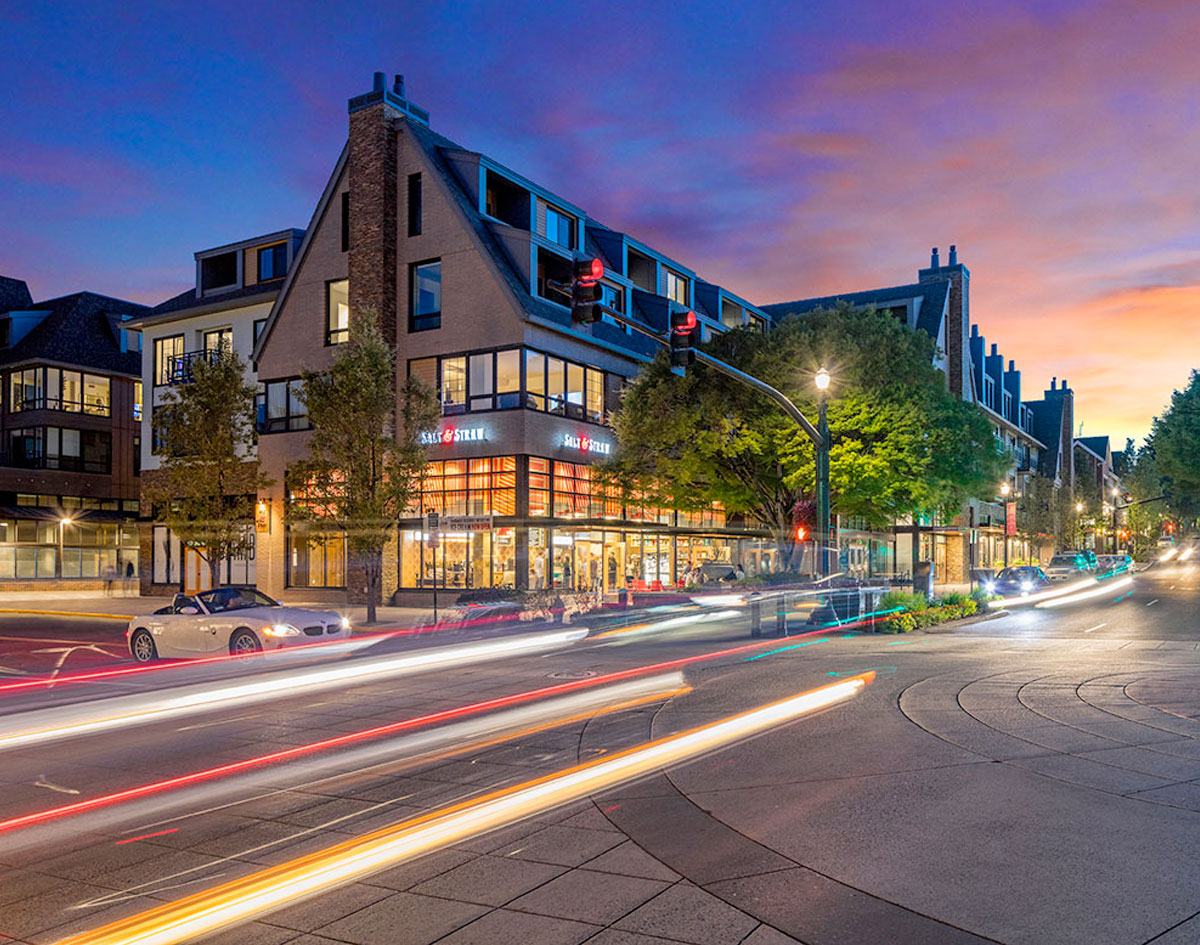
Home to many Portland-area business leaders and professionals, Lake Oswego is a safe and secure place to do business that is known for its natural beauty, recreational and cultural amenities, top-ranked schools and sense of community. With 41,000 residents, Lake Oswego is Clackamas County’s largest city. Downtown Lake Oswego is a lively dining and specialty shopping district, with both lakefront and riverfront parks, a performing arts center and renowned outdoor sculpture walk. With more than 2.3 million square feet of office space, the prestigious Kruse Way corridor is home to a significant concentration of corporate headquarters and professional service firms. Learn more here.
Population
Population
| Population | 2000 | 2010 | 2025 | 2030 |
|---|---|---|---|---|
| Lake Oswego, OR | 35,936 | 36,815 | 41,141 | 41,411 |
Source: ESRI, 2025-08-25
Population by Age
| Population | 2025 |
|---|---|
| 0-4 | 1,496 |
| 5-9 | 1,934 |
| 10-14 | 2,563 |
| 15-19 | 2,672 |
| 20-24 | 2,039 |
| 25-29 | 1,791 |
| 30-34 | 1,865 |
| 35-39 | 1,949 |
| 40-44 | 2,613 |
| 45-49 | 2,791 |
| 50-54 | 3,096 |
| 55-59 | 2,842 |
| 60-64 | 2,707 |
| 65-69 | 2,664 |
| 70-74 | 2,649 |
| 75-79 | 2,466 |
| 80-84 | 1,567 |
| 85+ | 1,437 |
| 18+ | 33,494 |
| Median Age | 48 |
Source: ESRI, 2025-08-25
Population by Race
| Lake Oswego, OR | 2025 |
|---|---|
| Total | 41,141.00 |
| White Alone | 78.16% |
| Black Alone | 1.03% |
| American Indian Alone | 0.3% |
| Asian Alone | 9.19% |
| Pacific Islander Alone | 0.15% |
| Some Other Race | 1.51% |
| Two or More Races | 9.66% |
| Hispanic Origin | 5.82% |
| Diversity Index | 44.00 |
Source: ESRI, 2025-08-25
Growth Rate
| Lake Oswego, OR | 2025 - 2030 |
|---|---|
| Population | 0.13% |
| Households | 0.26% |
| Families | 0.41% |
| Median Household Income | 4% |
| Per Capita Income | 2% |
Source: ESRI, 2025-08-25
Housing
Households
| Population | 2000 | 2010 | 2025 | 2030 |
|---|---|---|---|---|
| Households | 15,027 | 15,986 | 17,497 | 17,722 |
| Housing Units | 16,007 | 17,096 | 18,838 | 19,107 |
| Owner Occupied Units | 12,375 | 12,596 | ||
| Renter Occupied Units | 5,122 | 5,126 | ||
| Vacant Units | 1,341 | 1,385 |
Source: ESRI, 2025-08-25
Home Value
| Lake Oswego, OR | 2025 | 2030 |
|---|---|---|
| Median Home Value | $925,690 | $989,635 |
| Average Home Value | $1,064,445 | $1,128,112 |
| <$50,000 | 44 | 5 |
| $50,000 - $99,999 | 39 | 8 |
| $100,000 - $149,999 | 31 | 1 |
| $150,000 - $199,999 | 16 | 0 |
| $200,000 - $249,999 | 33 | 1 |
| $250,000 - $299,999 | 38 | 3 |
| $300,000 - $399,999 | 118 | 19 |
| $400,000 - $499,999 | 316 | 115 |
| $500,000 - $749,999 | 2,752 | 1,869 |
| $1,000,000 + | 2,982 | 4,085 |
Source: ESRI, 2025-08-25
Housing Year Built
| Year Range | Houses Built |
|---|---|
| 2010 or Later | 1,310 |
| 2000-2009 | 1,831 |
| 1990-1999 | 2,254 |
| 1980-1989 | 3,597 |
| 1970-1979 | 3,893 |
| 1960-1969 | 2,306 |
| 1950-1959 | 1,555 |
| 1940-1949 | 547 |
| 1939 or Before | 596 |
Source: ESRI, 2025-08-25
Back To TopIncome
Income
| Lake Oswego, OR | 2025 | 2030 |
|---|---|---|
| Median Household | $142,363 | $170,039 |
| Average Household | $221,325 | $247,588 |
| Per Capita | $94,145 | $105,973 |
Source: ESRI, 2025-08-25
Household Income
| Lake Oswego, OR | 2025 |
|---|---|
| <$15,000 | 556 |
| $15,000 - $24,999 | 552 |
| $25,000 - $34,999 | 449 |
| $35,000 - $49,999 | 682 |
| $50,000 - $74,999 | 1,853 |
| $75,000 - $99,999 | 1,668 |
| $100,000 - $149,999 | 3,426 |
| $150,000 - $199,999 | 1,759 |
| $200,000+ | 6,552 |
Source: ESRI, 2025-08-25
Back To TopEmployees
Commute
| Category | Commuters |
|---|---|
| Workers 16+ | 18,828 |
| In-County Residents | 10,839 |
| Out-of-County Residents | 7,540 |
| Drive Alone | 11,371 |
| Carpooled | 750 |
| Public Transport | 231 |
| Work at Home | 5,779 |
| Motorcycle | 59 |
| Bicycle | 103 |
| Walked | 260 |
| Other | 275 |
| Less than 5 minutes | 167 |
| 5-9 minutes | 1,378 |
| 10-14 minutes | 1,869 |
| 15-19 minutes | 2,279 |
| 20-24 minutes | 2,341 |
| 25-29 minutes | 955 |
| 30-34 minutes | 2,191 |
| 35-39 minutes | 337 |
| 40-44 minutes | 489 |
| 45-59 minutes | 742 |
| 60-89 minutes | 175 |
| 90+ minutes | 128 |
| Average Travel Time | 0 |
Source: ESRI, 2025-08-25
Source: ESRI, 2025-08-25
Employees by NAICS
| Category | Number |
|---|---|
| Total Employees | 24,543 |
| Agr/Forestry/Fish/Hunt | 19 |
| Mining | 16 |
| Utilities | 18 |
| Construction | 727 |
| Manufacturing | 1,848 |
| Wholesale Trade | 405 |
| Retail Trade | 1,584 |
| Motor Veh/Parts Dealers | 54 |
| Furn & Home Furnish Str | 51 |
| Electronics & Appl Store | 24 |
| Bldg Matl/Garden Equip | 146 |
| Food & Beverage Stores | 734 |
| Health/Pers Care Stores | 129 |
| Gasoline Stations | 76 |
| Clothing/Accessory Store | 105 |
| Sports/Hobby/Book/Music | 203 |
| General Merchandise Str | 62 |
| Transportation/Warehouse | 222 |
| Information | 585 |
| Finance & Insurance | 3,184 |
| Cntrl Bank/Crdt Intrmdtn | 745 |
| Sec/Cmdty Cntrct/Oth Inv | 1,403 |
| Insur/Funds/Trusts/Other | 1,036 |
| Real Estate/Rent/Leasing | 1,126 |
| Prof/Scientific/Tech Srv | 2,841 |
| Legal Services | 828 |
| Mgmt of Comp/Enterprises | 24 |
| Admin/Support/Waste Mgmt | 425 |
| Educational Services | 3,874 |
| HealthCare/Social Assist | 3,629 |
| Arts/Entertainment/Rec | 357 |
| Accommodation/Food Srvcs | 1,740 |
| Accommodation | 256 |
| Food Srv/Drinking Places | 1,484 |
| Other Srv excl Pub Admin | 1,251 |
| Auto Repair/Maintenance | 67 |
| Public Administration Emp | 659 |
Source: ESRI, 2025-08-25
Educational Attainment (25+)
| Lake Oswego, OR | 2025 |
|---|---|
| <9th Grade | 71 |
| Some High School | 141 |
| GED | 494 |
| Graduated High School | 1,449 |
| Some College/No Degree | 3,291 |
| Associates Degree | 1,768 |
| Bachelor's Degree | 13,313 |
| Graduate Degree | 9,910 |
Source: ESRI, 2025-08-25
Back To TopBusinesses
Businesses by NAICS
| Category | Number |
|---|---|
| Total Businesses | 2,484 |
| Agr/Forestry/Fish/Hunt Bus | 7 |
| Mining Bus | 1 |
| Utilities Bus | 3 |
| Construction Bus | 117 |
| Manufacturing Bus | 74 |
| Wholesale Trade Bus | 65 |
| Retail Trade Bus | 171 |
| Motor Veh/Parts Dealers Bus | 5 |
| Furn & Home Furnish Str Bus | 9 |
| Electronics & Appl Store Bus | 9 |
| Bldg Matl/Garden Equip Bus | 19 |
| Food & Beverage Stores Bus | 26 |
| Health/Pers Care Stores Bus | 18 |
| Gasoline Stations Bus | 9 |
| Clothing/Accessory Store Bus | 24 |
| Sports/Hobby/Book/Music Bus | 36 |
| General Merchandise Str Bus | 16 |
| Transportation/Warehouse Bus | 21 |
| Information Bus | 39 |
| Finance & Insurance Bus | 347 |
| Cntrl Bank/Crdt Intrmdtn Bus | 93 |
| Sec/Cmdty Cntrct/Oth Inv Bus | 162 |
| Insur/Funds/Trusts/Other Bus | 92 |
| Real Estate/Rent/Leasing Bus | 198 |
| Prof/Scientific/Tech Srv Bus | 415 |
| Legal Services Bus | 136 |
| Mgmt of Comp/Enterprises Bus | 7 |
| Admin/Support/Waste Mgmt Bus | 79 |
| Educational Services Bus | 63 |
| HealthCare/Social Assist Bus | 270 |
| Arts/Entertainment/Rec Bus | 63 |
| Accommodation/Food Srvcs Bus | 129 |
| Accommodation Bus | 11 |
| Food Srv/Drinking Places Bus | 118 |
| Other Srv excl Pub Admin Bus | 215 |
| Auto Repair/Maintenance Bus | 10 |
| Public Administration Bus | 36 |
Source: ESRI, 2025-08-25
Back To Top