
McMinnville, OR
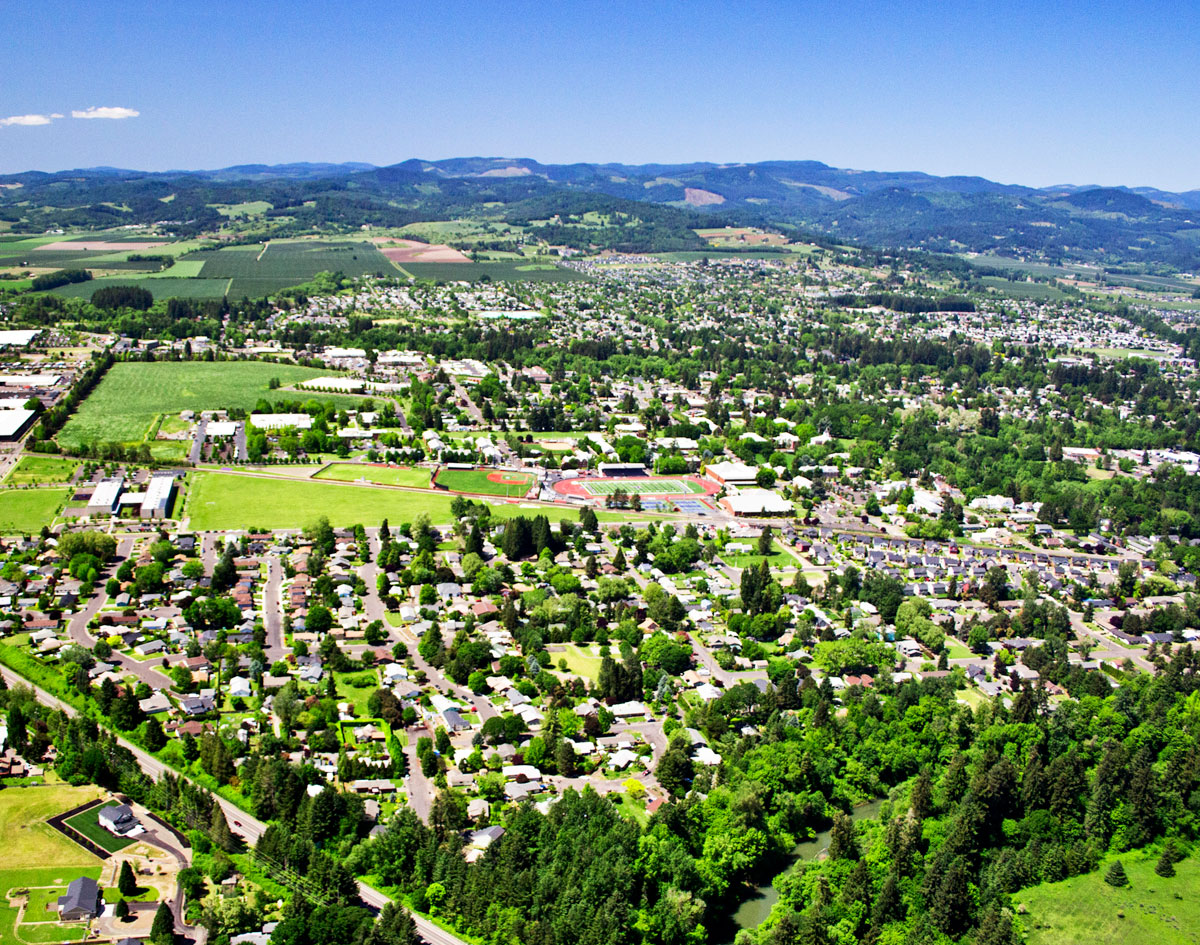
Located in the agriculturally rich Willamette Valley, McMinnville has big-city amenities and small-town charm. McMinnville has an active municipal airport and is an easy drive to Portland, the coast and the state capital of Salem. With a labor force of 800,000 within a 45-minute drive of McMinnville, more than 90 manufacturing companies have discovered a skilled workforce in a well-planned community with one of the lowest combined utilities costs. McMinnville is home to Linfield University, Chemeketa Community College and an innovative entrepreneurial ecosystem. McMinnville has award-winning wineries, farm-to-fork restaurants, a nationally recognized historic main street, and leaders who work together for a prosperous community. Learn more here.
Population
Population
| Population | 2000 | 2010 | 2025 | 2030 |
|---|---|---|---|---|
| McMinnville, OR | 26,372 | 32,212 | 35,042 | 35,626 |
Source: ESRI, 2025-08-25
Population by Age
| Population | 2025 |
|---|---|
| 0-4 | 1,793 |
| 5-9 | 1,866 |
| 10-14 | 2,059 |
| 15-19 | 2,731 |
| 20-24 | 2,614 |
| 25-29 | 2,200 |
| 30-34 | 2,103 |
| 35-39 | 2,150 |
| 40-44 | 2,248 |
| 45-49 | 1,992 |
| 50-54 | 1,979 |
| 55-59 | 1,843 |
| 60-64 | 1,920 |
| 65-69 | 1,859 |
| 70-74 | 1,838 |
| 75-79 | 1,625 |
| 80-84 | 1,174 |
| 85+ | 1,048 |
| 18+ | 28,019 |
| Median Age | 40 |
Source: ESRI, 2025-08-25
Population by Race
| McMinnville, OR | 2025 |
|---|---|
| Total | 35,042.00 |
| White Alone | 71.25% |
| Black Alone | 0.61% |
| American Indian Alone | 1.47% |
| Asian Alone | 1.56% |
| Pacific Islander Alone | 0.24% |
| Some Other Race | 12.54% |
| Two or More Races | 12.32% |
| Hispanic Origin | 25.32% |
| Diversity Index | 66.50 |
Source: ESRI, 2025-08-25
Growth Rate
| McMinnville, OR | 2025 - 2030 |
|---|---|
| Population | 0.33% |
| Households | 0.65% |
| Families | 0.50% |
| Median Household Income | 3% |
| Per Capita Income | 3% |
Source: ESRI, 2025-08-25
Housing
Households
| Population | 2000 | 2010 | 2025 | 2030 |
|---|---|---|---|---|
| Households | 9,300 | 11,679 | 13,113 | 13,543 |
| Housing Units | 9,767 | 12,396 | 13,914 | 14,370 |
| Owner Occupied Units | 8,164 | 8,642 | ||
| Renter Occupied Units | 4,949 | 4,901 | ||
| Vacant Units | 801 | 827 |
Source: ESRI, 2025-08-25
Home Value
| McMinnville, OR | 2025 | 2030 |
|---|---|---|
| Median Home Value | $461,635 | $543,012 |
| Average Home Value | $487,150 | $572,928 |
| <$50,000 | 459 | 350 |
| $50,000 - $99,999 | 290 | 262 |
| $100,000 - $149,999 | 86 | 39 |
| $150,000 - $199,999 | 33 | 7 |
| $200,000 - $249,999 | 163 | 55 |
| $250,000 - $299,999 | 235 | 98 |
| $300,000 - $399,999 | 1,436 | 857 |
| $400,000 - $499,999 | 2,239 | 2,040 |
| $500,000 - $749,999 | 2,497 | 3,563 |
| $1,000,000 + | 138 | 283 |
Source: ESRI, 2025-08-25
Housing Year Built
| Year Range | Houses Built |
|---|---|
| 2010 or Later | 1,293 |
| 2000-2009 | 2,111 |
| 1990-1999 | 3,255 |
| 1980-1989 | 1,783 |
| 1970-1979 | 2,218 |
| 1960-1969 | 544 |
| 1950-1959 | 659 |
| 1940-1949 | 522 |
| 1939 or Before | 855 |
Source: ESRI, 2025-08-25
Back To TopIncome
Income
| McMinnville, OR | 2025 | 2030 |
|---|---|---|
| Median Household | $78,312 | $89,737 |
| Average Household | $97,158 | $109,023 |
| Per Capita | $36,534 | $41,618 |
Source: ESRI, 2025-08-25
Household Income
| McMinnville, OR | 2025 |
|---|---|
| <$15,000 | 1,858 |
| $15,000 - $24,999 | 885 |
| $25,000 - $34,999 | 706 |
| $35,000 - $49,999 | 1,043 |
| $50,000 - $74,999 | 1,772 |
| $75,000 - $99,999 | 1,727 |
| $100,000 - $149,999 | 2,572 |
| $150,000 - $199,999 | 1,534 |
| $200,000+ | 1,016 |
Source: ESRI, 2025-08-25
Back To TopEmployees
Commute
| Category | Commuters |
|---|---|
| Workers 16+ | 14,116 |
| In-County Residents | 11,500 |
| Out-of-County Residents | 2,578 |
| Drive Alone | 9,937 |
| Carpooled | 1,184 |
| Public Transport | 84 |
| Work at Home | 1,587 |
| Motorcycle | 0 |
| Bicycle | 133 |
| Walked | 971 |
| Other | 205 |
| Less than 5 minutes | 795 |
| 5-9 minutes | 3,343 |
| 10-14 minutes | 2,451 |
| 15-19 minutes | 1,070 |
| 20-24 minutes | 873 |
| 25-29 minutes | 503 |
| 30-34 minutes | 1,010 |
| 35-39 minutes | 201 |
| 40-44 minutes | 381 |
| 45-59 minutes | 1,091 |
| 60-89 minutes | 657 |
| 90+ minutes | 154 |
| Average Travel Time | 21 |
Source: ESRI, 2025-08-25
Source: ESRI, 2025-08-25
Employees by NAICS
| Category | Number |
|---|---|
| Total Employees | 15,789 |
| Agr/Forestry/Fish/Hunt | 34 |
| Mining | 4 |
| Utilities | 125 |
| Construction | 441 |
| Manufacturing | 1,887 |
| Wholesale Trade | 556 |
| Retail Trade | 2,634 |
| Motor Veh/Parts Dealers | 456 |
| Furn & Home Furnish Str | 39 |
| Electronics & Appl Store | 3 |
| Bldg Matl/Garden Equip | 320 |
| Food & Beverage Stores | 745 |
| Health/Pers Care Stores | 151 |
| Gasoline Stations | 75 |
| Clothing/Accessory Store | 27 |
| Sports/Hobby/Book/Music | 370 |
| General Merchandise Str | 448 |
| Transportation/Warehouse | 333 |
| Information | 267 |
| Finance & Insurance | 331 |
| Cntrl Bank/Crdt Intrmdtn | 162 |
| Sec/Cmdty Cntrct/Oth Inv | 57 |
| Insur/Funds/Trusts/Other | 112 |
| Real Estate/Rent/Leasing | 255 |
| Prof/Scientific/Tech Srv | 862 |
| Legal Services | 119 |
| Mgmt of Comp/Enterprises | 2 |
| Admin/Support/Waste Mgmt | 277 |
| Educational Services | 1,517 |
| HealthCare/Social Assist | 2,654 |
| Arts/Entertainment/Rec | 304 |
| Accommodation/Food Srvcs | 1,370 |
| Accommodation | 97 |
| Food Srv/Drinking Places | 1,273 |
| Other Srv excl Pub Admin | 1,032 |
| Auto Repair/Maintenance | 152 |
| Public Administration Emp | 892 |
Source: ESRI, 2025-08-25
Educational Attainment (25+)
| McMinnville, OR | 2025 |
|---|---|
| <9th Grade | 942 |
| Some High School | 1,703 |
| GED | 1,289 |
| Graduated High School | 4,825 |
| Some College/No Degree | 5,917 |
| Associates Degree | 2,166 |
| Bachelor's Degree | 4,601 |
| Graduate Degree | 2,536 |
Source: ESRI, 2025-08-25
Back To TopBusinesses
Businesses by NAICS
| Category | Number |
|---|---|
| Total Businesses | 1,487 |
| Agr/Forestry/Fish/Hunt Bus | 11 |
| Mining Bus | 1 |
| Utilities Bus | 3 |
| Construction Bus | 83 |
| Manufacturing Bus | 85 |
| Wholesale Trade Bus | 38 |
| Retail Trade Bus | 202 |
| Motor Veh/Parts Dealers Bus | 26 |
| Furn & Home Furnish Str Bus | 9 |
| Electronics & Appl Store Bus | 2 |
| Bldg Matl/Garden Equip Bus | 15 |
| Food & Beverage Stores Bus | 46 |
| Health/Pers Care Stores Bus | 17 |
| Gasoline Stations Bus | 9 |
| Clothing/Accessory Store Bus | 9 |
| Sports/Hobby/Book/Music Bus | 54 |
| General Merchandise Str Bus | 15 |
| Transportation/Warehouse Bus | 22 |
| Information Bus | 30 |
| Finance & Insurance Bus | 53 |
| Cntrl Bank/Crdt Intrmdtn Bus | 23 |
| Sec/Cmdty Cntrct/Oth Inv Bus | 12 |
| Insur/Funds/Trusts/Other Bus | 18 |
| Real Estate/Rent/Leasing Bus | 67 |
| Prof/Scientific/Tech Srv Bus | 122 |
| Legal Services Bus | 28 |
| Mgmt of Comp/Enterprises Bus | 1 |
| Admin/Support/Waste Mgmt Bus | 34 |
| Educational Services Bus | 39 |
| HealthCare/Social Assist Bus | 198 |
| Arts/Entertainment/Rec Bus | 33 |
| Accommodation/Food Srvcs Bus | 131 |
| Accommodation Bus | 11 |
| Food Srv/Drinking Places Bus | 120 |
| Other Srv excl Pub Admin Bus | 209 |
| Auto Repair/Maintenance Bus | 36 |
| Public Administration Bus | 65 |
Source: ESRI, 2025-08-25
Back To Top