
Beaverton, OR
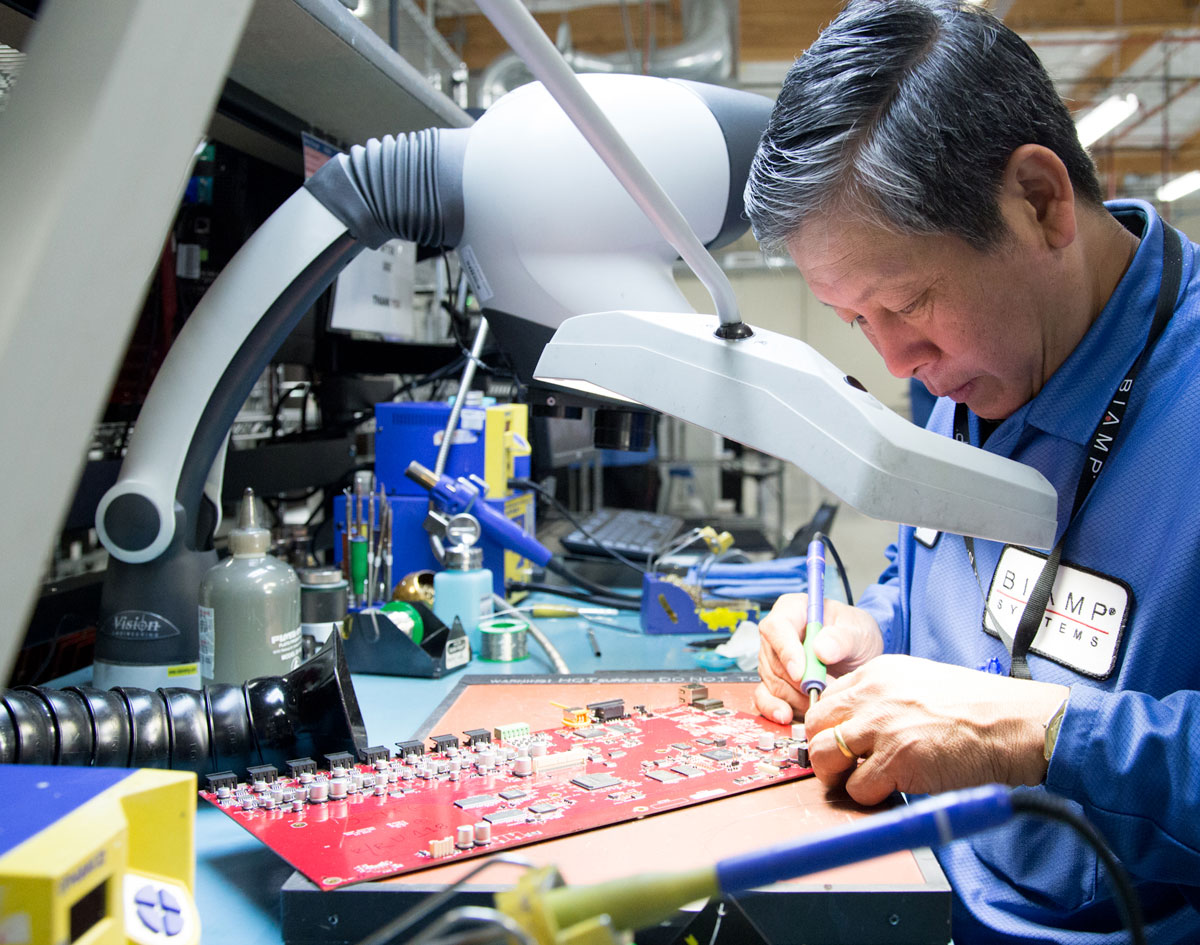
As the birthplace of the Silicon Forest and home to companies small and large, Beaverton has innovation and drive in its DNA. Beaverton is known for its embrace of diversity, a thriving startup scene and a commitment to the arts with the opening of a new performing arts and community center. Beaverton is centrally located, served by light rail and two interstates, and offers a diverse supply of office, industrial and flex space for businesses looking to grow. Beaverton is a great place to live and work, with highly regarded public and private schools and a well-recognized and growing restaurant scene downtown. Learn more here.
Population
Population
| Population | 2000 | 2010 | 2024 | 2029 |
|---|---|---|---|---|
| Beaverton, OR | 78,634 | 89,756 | 100,633 | 103,510 |
Source: ESRI, 2024-09-27
Population by Age
| Population | 2024 |
|---|---|
| 0-4 | 5,280 |
| 5-9 | 5,457 |
| 10-14 | 5,260 |
| 15-19 | 5,300 |
| 20-24 | 6,590 |
| 25-29 | 8,523 |
| 30-34 | 9,570 |
| 35-39 | 8,301 |
| 40-44 | 7,464 |
| 45-49 | 6,317 |
| 50-54 | 6,317 |
| 55-59 | 5,405 |
| 60-64 | 5,136 |
| 65-69 | 4,687 |
| 70-74 | 4,104 |
| 75-79 | 3,101 |
| 80-84 | 1,824 |
| 85+ | 1,997 |
| 18+ | 81,395 |
| Median Age | 38 |
Source: ESRI, 2024-09-27
Population by Race
| Beaverton, OR | 2024 |
|---|---|
| Total | 100,633.00 |
| White Alone | 60.25% |
| Black Alone | 3.06% |
| American Indian Alone | 1.02% |
| Asian Alone | 12.71% |
| Pacific Islander Alone | 0.58% |
| Some Other Race | 9.14% |
| Two or More Races | 13.24% |
| Hispanic Origin | 19.16% |
| Diversity Index | 72.00 |
Source: ESRI, 2024-09-27
Growth Rate
| Beaverton, OR | 2024 - 2029 |
|---|---|
| Population | 0.57% |
| Households | 0.75% |
| Families | 0.57% |
| Median Household Income | 3% |
| Per Capita Income | 3% |
Source: ESRI, 2024-09-27
Housing
Households
| Population | 2000 | 2010 | 2024 | 2029 |
|---|---|---|---|---|
| Households | 31,897 | 37,220 | 41,770 | 43,360 |
| Housing Units | 33,647 | 39,507 | 44,000 | 45,581 |
| Owner Occupied Units | 20,450 | 21,229 | ||
| Renter Occupied Units | 21,320 | 22,131 | ||
| Vacant Units | 2,230 | 2,221 |
Source: ESRI, 2024-09-27
Home Value
| Beaverton, OR | 2024 | 2029 |
|---|---|---|
| Median Home Value | $616,047 | $652,665 |
| Average Home Value | $624,985 | $688,622 |
| <$50,000 | 281 | 122 |
| $50,000 - $99,999 | 160 | 56 |
| $100,000 - $149,999 | 97 | 26 |
| $150,000 - $199,999 | 238 | 74 |
| $200,000 - $249,999 | 215 | 45 |
| $250,000 - $299,999 | 357 | 50 |
| $300,000 - $399,999 | 1,109 | 689 |
| $400,000 - $499,999 | 2,251 | 1,637 |
| $500,000 - $749,999 | 11,881 | 12,954 |
| $1,000,000 + | 450 | 814 |
Source: ESRI, 2024-09-27
Housing Year Built
| Year Range | Houses Built |
|---|---|
| 2010 or Later | 3,250 |
| 2000-2009 | 6,903 |
| 1990-1999 | 7,527 |
| 1980-1989 | 7,592 |
| 1970-1979 | 9,279 |
| 1960-1969 | 4,640 |
| 1950-1959 | 1,757 |
| 1940-1949 | 867 |
| 1939 or Before | 645 |
Source: ESRI, 2024-09-27
Back To TopIncome
Income
| Beaverton, OR | 2024 | 2029 |
|---|---|---|
| Median Household | $92,565 | $106,008 |
| Average Household | $126,147 | $145,526 |
| Per Capita | $52,377 | $60,977 |
Source: ESRI, 2024-09-27
Household Income
| Beaverton, OR | 2024 |
|---|---|
| <$15,000 | 2,290 |
| $15,000 - $24,999 | 2,216 |
| $25,000 - $34,999 | 2,072 |
| $35,000 - $49,999 | 3,322 |
| $50,000 - $74,999 | 6,249 |
| $75,000 - $99,999 | 6,246 |
| $100,000 - $149,999 | 8,513 |
| $150,000 - $199,999 | 4,657 |
| $200,000+ | 6,205 |
Source: ESRI, 2024-09-27
Back To TopEmployees
Commute
| Category | Commuters |
|---|---|
| Workers 16+ | 54,260 |
| In-County Residents | 39,723 |
| Out-of-County Residents | 13,663 |
| Drive Alone | 34,598 |
| Carpooled | 3,576 |
| Public Transport | 3,309 |
| Work at Home | 9,676 |
| Motorcycle | 38 |
| Bicycle | 507 |
| Walked | 1,920 |
| Other | 620 |
| Less than 5 minutes | 910 |
| 5-9 minutes | 3,272 |
| 10-14 minutes | 6,501 |
| 15-19 minutes | 7,420 |
| 20-24 minutes | 7,282 |
| 25-29 minutes | 3,885 |
| 30-34 minutes | 6,150 |
| 35-39 minutes | 1,908 |
| 40-44 minutes | 2,149 |
| 45-59 minutes | 2,874 |
| 60-89 minutes | 1,826 |
| 90+ minutes | 408 |
| Average Travel Time | 0 |
Source: ESRI, 2024-09-27
Source: ESRI, 2024-09-27
Employees by NAICS
| Category | Number |
|---|---|
| Total Employees | 57,938 |
| Agr/Forestry/Fish/Hunt | 33 |
| Mining | 1 |
| Utilities | 284 |
| Construction | 1,771 |
| Manufacturing | 3,338 |
| Wholesale Trade | 3,381 |
| Retail Trade | 8,976 |
| Motor Veh/Parts Dealers | 2,185 |
| Furn & Home Furnish Str | 291 |
| Electronics & Appl Store | 340 |
| Bldg Matl/Garden Equip | 853 |
| Food & Beverage Stores | 2,060 |
| Health/Pers Care Stores | 482 |
| Gasoline Stations | 268 |
| Clothing/Accessory Store | 432 |
| Sports/Hobby/Book/Music | 1,103 |
| General Merchandise Str | 962 |
| Transportation/Warehouse | 655 |
| Information | 1,890 |
| Finance & Insurance | 2,906 |
| Cntrl Bank/Crdt Intrmdtn | 1,031 |
| Sec/Cmdty Cntrct/Oth Inv | 546 |
| Insur/Funds/Trusts/Other | 1,329 |
| Real Estate/Rent/Leasing | 2,524 |
| Prof/Scientific/Tech Srv | 4,828 |
| Legal Services | 402 |
| Mgmt of Comp/Enterprises | 150 |
| Admin/Support/Waste Mgmt | 2,555 |
| Educational Services | 3,648 |
| HealthCare/Social Assist | 7,566 |
| Arts/Entertainment/Rec | 3,130 |
| Accommodation/Food Srvcs | 5,008 |
| Accommodation | 340 |
| Food Srv/Drinking Places | 4,668 |
| Other Srv excl Pub Admin | 3,599 |
| Auto Repair/Maintenance | 521 |
| Public Administration Emp | 1,493 |
Source: ESRI, 2024-09-27
Educational Attainment (25+)
| Beaverton, OR | 2024 |
|---|---|
| <9th Grade | 2,169 |
| Some High School | 1,905 |
| GED | 2,064 |
| Graduated High School | 10,067 |
| Some College/No Degree | 13,193 |
| Associates Degree | 6,103 |
| Bachelor's Degree | 23,787 |
| Graduate Degree | 13,458 |
Source: ESRI, 2024-09-27
Back To TopBusinesses
Businesses by NAICS
| Category | Number |
|---|---|
| Total Businesses | 5,076 |
| Agr/Forestry/Fish/Hunt Bus | 7 |
| Mining Bus | 1 |
| Utilities Bus | 5 |
| Construction Bus | 236 |
| Manufacturing Bus | 162 |
| Wholesale Trade Bus | 139 |
| Retail Trade Bus | 602 |
| Motor Veh/Parts Dealers Bus | 57 |
| Furn & Home Furnish Str Bus | 47 |
| Electronics & Appl Store Bus | 37 |
| Bldg Matl/Garden Equip Bus | 49 |
| Food & Beverage Stores Bus | 106 |
| Health/Pers Care Stores Bus | 54 |
| Gasoline Stations Bus | 28 |
| Clothing/Accessory Store Bus | 50 |
| Sports/Hobby/Book/Music Bus | 117 |
| General Merchandise Str Bus | 57 |
| Transportation/Warehouse Bus | 51 |
| Information Bus | 132 |
| Finance & Insurance Bus | 300 |
| Cntrl Bank/Crdt Intrmdtn Bus | 96 |
| Sec/Cmdty Cntrct/Oth Inv Bus | 84 |
| Insur/Funds/Trusts/Other Bus | 120 |
| Real Estate/Rent/Leasing Bus | 325 |
| Prof/Scientific/Tech Srv Bus | 549 |
| Legal Services Bus | 93 |
| Mgmt of Comp/Enterprises Bus | 12 |
| Admin/Support/Waste Mgmt Bus | 196 |
| Educational Services Bus | 128 |
| HealthCare/Social Assist Bus | 712 |
| Arts/Entertainment/Rec Bus | 122 |
| Accommodation/Food Srvcs Bus | 407 |
| Accommodation Bus | 14 |
| Food Srv/Drinking Places Bus | 393 |
| Other Srv excl Pub Admin Bus | 569 |
| Auto Repair/Maintenance Bus | 67 |
| Public Administration Bus | 64 |
Source: ESRI, 2024-09-27
Back To Top