
Tualatin, OR
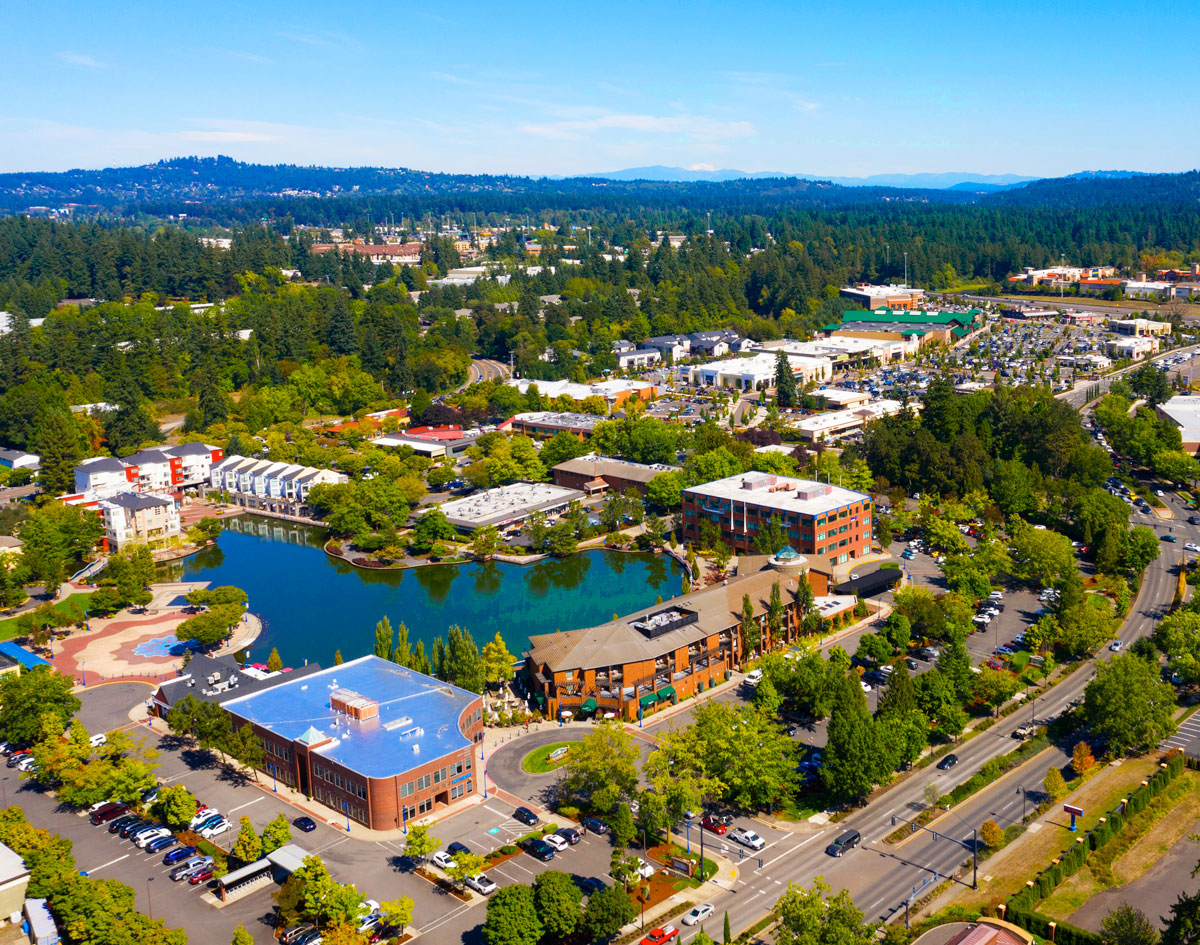
As one of the largest employment hubs for semiconductor manufacturing in Oregon, Tualatin is a regional leader in advanced manufacturing and informational technology. Nestled along the beautiful Tualatin River, Tualatin is home to one of the nation’s premier outdoor lifestyle centers – Bridgeport Village, boasting over 75 premier retail, boutique and restaurant options with a state-of-the-art Regal IMAX theater. With access to excellent schools, high-wage employment opportunities and quality of life amenities, Tualatin is one Oregon’s fastest growing communities since 2000. Learn more here.
Population
Population
| Population | 2000 | 2010 | 2025 | 2030 |
|---|---|---|---|---|
| Tualatin, OR | 22,911 | 26,097 | 27,555 | 27,343 |
Source: ESRI, 2025-08-25
Population by Age
| Population | 2025 |
|---|---|
| 0-4 | 1,469 |
| 5-9 | 1,612 |
| 10-14 | 1,723 |
| 15-19 | 1,671 |
| 20-24 | 1,911 |
| 25-29 | 1,912 |
| 30-34 | 2,020 |
| 35-39 | 1,911 |
| 40-44 | 2,015 |
| 45-49 | 1,809 |
| 50-54 | 1,817 |
| 55-59 | 1,657 |
| 60-64 | 1,534 |
| 65-69 | 1,395 |
| 70-74 | 1,280 |
| 75-79 | 901 |
| 80-84 | 495 |
| 85+ | 423 |
| 18+ | 21,720 |
| Median Age | 39 |
Source: ESRI, 2025-08-25
Population by Race
| Tualatin, OR | 2025 |
|---|---|
| Total | 27,555.00 |
| White Alone | 68.96% |
| Black Alone | 1.43% |
| American Indian Alone | 0.86% |
| Asian Alone | 4.69% |
| Pacific Islander Alone | 1.27% |
| Some Other Race | 9.31% |
| Two or More Races | 13.49% |
| Hispanic Origin | 19.81% |
| Diversity Index | 65.50 |
Source: ESRI, 2025-08-25
Growth Rate
| Tualatin, OR | 2025 - 2030 |
|---|---|
| Population | -0.15% |
| Households | -0.03% |
| Families | -0.17% |
| Median Household Income | 2% |
| Per Capita Income | 2% |
Source: ESRI, 2025-08-25
Housing
Households
| Population | 2000 | 2010 | 2025 | 2030 |
|---|---|---|---|---|
| Households | 8,700 | 10,017 | 10,797 | 10,783 |
| Housing Units | 9,274 | 10,546 | 11,080 | 11,121 |
| Owner Occupied Units | 6,013 | 6,072 | ||
| Renter Occupied Units | 4,784 | 4,711 | ||
| Vacant Units | 283 | 338 |
Source: ESRI, 2025-08-25
Home Value
| Tualatin, OR | 2025 | 2030 |
|---|---|---|
| Median Home Value | $629,309 | $662,694 |
| Average Home Value | $640,711 | $689,984 |
| <$50,000 | 11 | 4 |
| $50,000 - $99,999 | 92 | 50 |
| $100,000 - $149,999 | 8 | 2 |
| $150,000 - $199,999 | 48 | 1 |
| $200,000 - $249,999 | 41 | 2 |
| $250,000 - $299,999 | 75 | 30 |
| $300,000 - $399,999 | 278 | 240 |
| $400,000 - $499,999 | 651 | 440 |
| $500,000 - $749,999 | 3,481 | 3,482 |
| $1,000,000 + | 155 | 251 |
Source: ESRI, 2025-08-25
Housing Year Built
| Year Range | Houses Built |
|---|---|
| 2010 or Later | 750 |
| 2000-2009 | 1,696 |
| 1990-1999 | 3,513 |
| 1980-1989 | 2,295 |
| 1970-1979 | 2,676 |
| 1960-1969 | 199 |
| 1950-1959 | 111 |
| 1940-1949 | 15 |
| 1939 or Before | 171 |
Source: ESRI, 2025-08-25
Back To TopIncome
Income
| Tualatin, OR | 2025 | 2030 |
|---|---|---|
| Median Household | $109,644 | $120,631 |
| Average Household | $137,226 | $151,663 |
| Per Capita | $53,804 | $59,845 |
Source: ESRI, 2025-08-25
Household Income
| Tualatin, OR | 2025 |
|---|---|
| <$15,000 | 648 |
| $15,000 - $24,999 | 341 |
| $25,000 - $34,999 | 270 |
| $35,000 - $49,999 | 688 |
| $50,000 - $74,999 | 1,432 |
| $75,000 - $99,999 | 1,224 |
| $100,000 - $149,999 | 2,789 |
| $150,000 - $199,999 | 1,365 |
| $200,000+ | 2,040 |
Source: ESRI, 2025-08-25
Back To TopEmployees
Commute
| Category | Commuters |
|---|---|
| Workers 16+ | 14,640 |
| In-County Residents | 10,031 |
| Out-of-County Residents | 4,470 |
| Drive Alone | 10,045 |
| Carpooled | 963 |
| Public Transport | 302 |
| Work at Home | 2,797 |
| Motorcycle | 11 |
| Bicycle | 91 |
| Walked | 264 |
| Other | 129 |
| Less than 5 minutes | 209 |
| 5-9 minutes | 1,904 |
| 10-14 minutes | 1,977 |
| 15-19 minutes | 1,544 |
| 20-24 minutes | 1,473 |
| 25-29 minutes | 995 |
| 30-34 minutes | 1,661 |
| 35-39 minutes | 493 |
| 40-44 minutes | 489 |
| 45-59 minutes | 761 |
| 60-89 minutes | 253 |
| 90+ minutes | 84 |
| Average Travel Time | 0 |
Source: ESRI, 2025-08-25
Source: ESRI, 2025-08-25
Employees by NAICS
| Category | Number |
|---|---|
| Total Employees | 24,739 |
| Agr/Forestry/Fish/Hunt | 11 |
| Mining | 0 |
| Utilities | 109 |
| Construction | 1,824 |
| Manufacturing | 5,369 |
| Wholesale Trade | 1,807 |
| Retail Trade | 3,530 |
| Motor Veh/Parts Dealers | 66 |
| Furn & Home Furnish Str | 578 |
| Electronics & Appl Store | 264 |
| Bldg Matl/Garden Equip | 590 |
| Food & Beverage Stores | 185 |
| Health/Pers Care Stores | 299 |
| Gasoline Stations | 84 |
| Clothing/Accessory Store | 502 |
| Sports/Hobby/Book/Music | 830 |
| General Merchandise Str | 132 |
| Transportation/Warehouse | 333 |
| Information | 558 |
| Finance & Insurance | 306 |
| Cntrl Bank/Crdt Intrmdtn | 136 |
| Sec/Cmdty Cntrct/Oth Inv | 64 |
| Insur/Funds/Trusts/Other | 106 |
| Real Estate/Rent/Leasing | 584 |
| Prof/Scientific/Tech Srv | 1,265 |
| Legal Services | 77 |
| Mgmt of Comp/Enterprises | 107 |
| Admin/Support/Waste Mgmt | 733 |
| Educational Services | 786 |
| HealthCare/Social Assist | 3,580 |
| Arts/Entertainment/Rec | 384 |
| Accommodation/Food Srvcs | 1,844 |
| Accommodation | 82 |
| Food Srv/Drinking Places | 1,762 |
| Other Srv excl Pub Admin | 1,307 |
| Auto Repair/Maintenance | 220 |
| Public Administration Emp | 287 |
Source: ESRI, 2025-08-25
Educational Attainment (25+)
| Tualatin, OR | 2025 |
|---|---|
| <9th Grade | 518 |
| Some High School | 503 |
| GED | 701 |
| Graduated High School | 2,832 |
| Some College/No Degree | 3,629 |
| Associates Degree | 1,627 |
| Bachelor's Degree | 6,271 |
| Graduate Degree | 3,088 |
Source: ESRI, 2025-08-25
Back To TopBusinesses
Businesses by NAICS
| Category | Number |
|---|---|
| Total Businesses | 1,876 |
| Agr/Forestry/Fish/Hunt Bus | 4 |
| Mining Bus | 0 |
| Utilities Bus | 4 |
| Construction Bus | 141 |
| Manufacturing Bus | 174 |
| Wholesale Trade Bus | 108 |
| Retail Trade Bus | 227 |
| Motor Veh/Parts Dealers Bus | 14 |
| Furn & Home Furnish Str Bus | 22 |
| Electronics & Appl Store Bus | 11 |
| Bldg Matl/Garden Equip Bus | 36 |
| Food & Beverage Stores Bus | 23 |
| Health/Pers Care Stores Bus | 23 |
| Gasoline Stations Bus | 9 |
| Clothing/Accessory Store Bus | 39 |
| Sports/Hobby/Book/Music Bus | 36 |
| General Merchandise Str Bus | 14 |
| Transportation/Warehouse Bus | 20 |
| Information Bus | 40 |
| Finance & Insurance Bus | 67 |
| Cntrl Bank/Crdt Intrmdtn Bus | 24 |
| Sec/Cmdty Cntrct/Oth Inv Bus | 22 |
| Insur/Funds/Trusts/Other Bus | 21 |
| Real Estate/Rent/Leasing Bus | 99 |
| Prof/Scientific/Tech Srv Bus | 167 |
| Legal Services Bus | 24 |
| Mgmt of Comp/Enterprises Bus | 6 |
| Admin/Support/Waste Mgmt Bus | 64 |
| Educational Services Bus | 34 |
| HealthCare/Social Assist Bus | 245 |
| Arts/Entertainment/Rec Bus | 31 |
| Accommodation/Food Srvcs Bus | 124 |
| Accommodation Bus | 9 |
| Food Srv/Drinking Places Bus | 115 |
| Other Srv excl Pub Admin Bus | 194 |
| Auto Repair/Maintenance Bus | 45 |
| Public Administration Bus | 21 |
Source: ESRI, 2025-08-25
Back To Top