


Lake Oswego, OR
Lake Oswego, OR
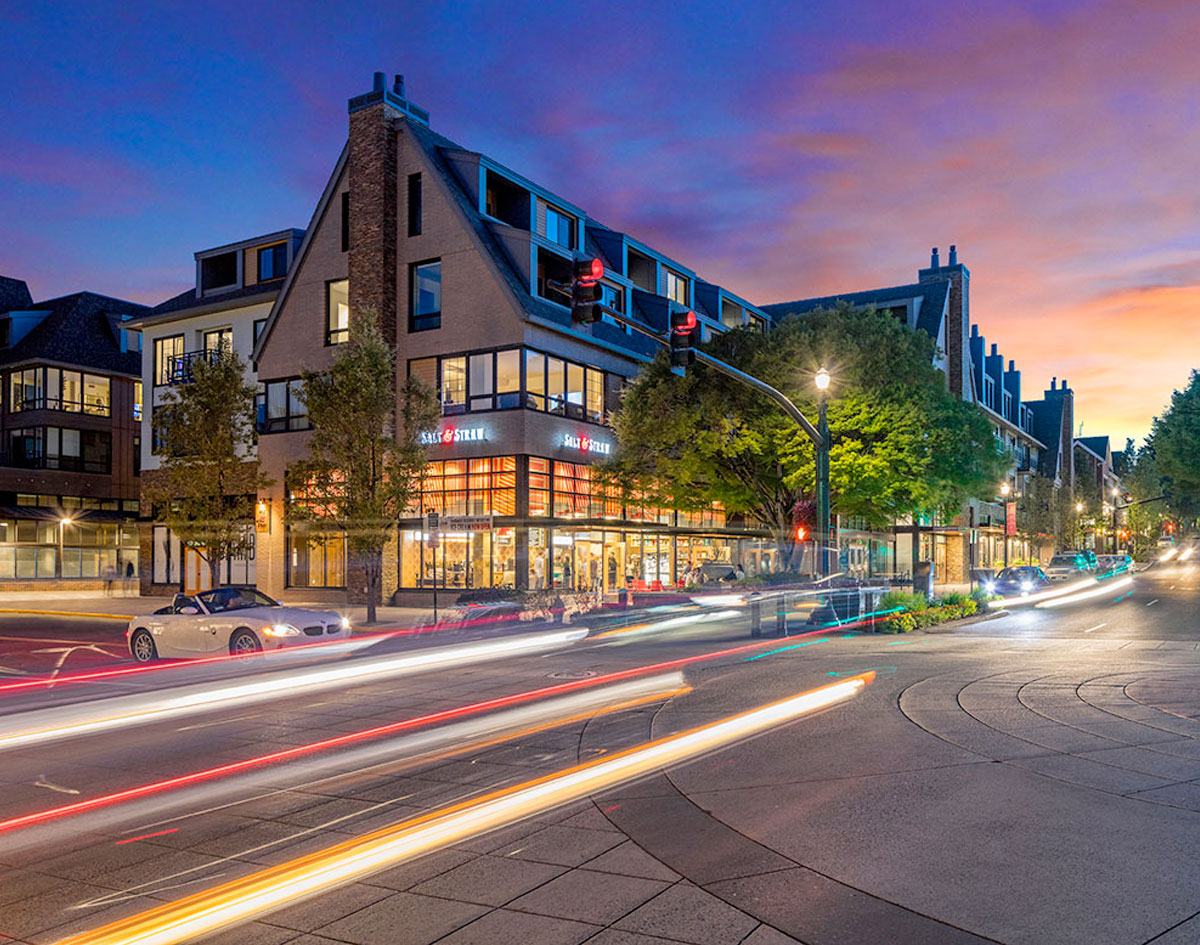
Home to many Portland-area business leaders and professionals, Lake Oswego is a safe and secure place to do business that is known for its natural beauty, recreational and cultural amenities, top-ranked schools and sense of community. With 41,000 residents, Lake Oswego is Clackamas County’s largest city. Downtown Lake Oswego is a lively dining and specialty shopping district, with both lakefront and riverfront parks, a performing arts center and renowned outdoor sculpture walk. With more than 2.3 million square feet of office space, the prestigious Kruse Way corridor is home to a significant concentration of corporate headquarters and professional service firms. Learn more here.
Population
Population
| Population | 2000 | 2010 | 2023 | 2028 |
|---|---|---|---|---|
| Lake Oswego, OR | 36,422 | 36,973 | 41,446 | 42,199 |
Source: ESRI, 2023-10-17
Population by Age
| Population | 2010 | 2023 | 2028 |
|---|---|---|---|
| 0-4 | 1,520 | 1,452 | 1,542 |
| 5-9 | 2,161 | 1,950 | 1,936 |
| 10-14 | 2,700 | 2,493 | 2,327 |
| 15-19 | 2,430 | 2,445 | 2,169 |
| 20-24 | 1,448 | 1,848 | 1,783 |
| 25-29 | 1,750 | 1,902 | 2,232 |
| 30-34 | 1,505 | 1,935 | 2,098 |
| 35-39 | 2,004 | 2,235 | 2,296 |
| 40-44 | 2,527 | 2,425 | 2,548 |
| 45-49 | 3,077 | 2,534 | 2,661 |
| 50-54 | 3,567 | 3,083 | 2,847 |
| 55-59 | 3,406 | 3,566 | 3,227 |
| 60-64 | 3,003 | 3,929 | 3,438 |
| 65-69 | 1,951 | 3,289 | 3,458 |
| 70-74 | 1,216 | 2,424 | 2,660 |
| 75-79 | 873 | 1,553 | 2,017 |
| 80-84 | 806 | 1,063 | 1,402 |
| 85+ | 1,025 | 1,320 | 1,558 |
| 18+ | 28,843 | 33,918 | 34,953 |
| Median Age | 46 | 49 | 49 |
Source: ESRI, 2023-10-17
Population by Race
| Lake Oswego, OR | 2023 |
|---|---|
| Total | 41,446.00 |
| White Alone | 79.52 |
| Black Alone | 0.91 |
| American Indian Alone | 0.29 |
| Asian Alone | 8.09 |
| Pacific Islander Alone | 0.14 |
| Some Other Race | 1.52 |
| Two or More Races | 9.52 |
| Hispanic Origin | 5.84 |
| Diversity Index | 42.30 |
Source: ESRI, 2023-10-17
Growth Rate
| Lake Oswego, OR | 2023 - 2028 |
|---|---|
| Population | 0.36% |
| Households | 0.42% |
| Families | 0.34% |
| Median Household Income | 3% |
| Per Capita Income | 3% |
Source: ESRI, 2023-10-17
Back To TopHousing
Households
| Population | 2000 | 2010 | 2023 | 2028 |
|---|---|---|---|---|
| Households | 15,188 | 16,061 | 17,507 | 17,880 |
| Housing Units | 16,177 | 17,188 | 18,777 | 19,113 |
| Owner Occupied Units | 12,645 | 13,017 | ||
| Renter Occupied Units | 4,862 | 4,863 | ||
| Vacant Units | 1,270 | 1,233 |
Source: ESRI, 2023-10-17
Home Value
| Lake Oswego, OR | 2023 | 2028 |
|---|---|---|
| Median Home Value | $771,890 | $821,994 |
| Average Home Value | $906,524 | $962,395 |
| <$50,000 | 7 | 0 |
| $50,000 - $99,999 | 24 | 0 |
| $100,000 - $149,999 | 19 | 0 |
| $150,000 - $199,999 | 3 | 0 |
| $200,000 - $249,999 | 9 | 0 |
| $250,000 - $299,999 | 9 | 0 |
| $300,000 - $399,999 | 103 | 36 |
| $400,000 - $499,999 | 601 | 347 |
| $500,000 - $749,999 | 5,247 | 5,225 |
| $1,000,000 + | 2,110 | 2,885 |
Source: ESRI, 2023-10-17
Housing Year Built
| Year Range | Houses Built |
|---|---|
| 2010 or Later | 1,003 |
| 2000-2009 | 1,578 |
| 1990-1999 | 2,650 |
| 1980-1989 | 3,555 |
| 1970-1979 | 3,760 |
| 1960-1969 | 2,365 |
| 1950-1959 | 1,658 |
| 1940-1949 | 633 |
| 1939 or Before | 651 |
Source: ESRI, 2023-10-17
Back To TopIncome
Income
| Lake Oswego, OR | 2023 | 2028 |
|---|---|---|
| Median Household | $124,806 | $144,003 |
| Average Household | $182,087 | $205,734 |
| Per Capita | $76,931 | $87,187 |
Source: ESRI, 2023-10-17
Household Income Base
| Lake Oswego, OR | 2023 |
|---|---|
| <$15,000 | 731 |
| $15,000 - $24,999 | 775 |
| $25,000 - $34,999 | 628 |
| $35,000 - $49,999 | 1,119 |
| $50,000 - $74,999 | 1,416 |
| $75,000 - $99,999 | 2,036 |
| $100,000 - $149,999 | 3,450 |
| $150,000 - $199,999 | 2,371 |
| $200,000+ | 4,981 |
Source: ESRI, 2023-10-17
Back To TopEmployees
Commute
| Category | Commuters |
|---|---|
| Workers 16+ | 18,993 |
| In-County Residents | 9,486 |
| Out-of-County Residents | 9,098 |
| Drive Alone | 12,981 |
| Carpooled | 1,061 |
| Public Transport | 470 |
| Work at Home | 3,797 |
| Less than 5 minutes | 254 |
| 5-9 minutes | 1,866 |
| 10-14 minutes | 1,948 |
| 15-19 minutes | 2,188 |
| 20-24 minutes | 2,209 |
| 25-29 minutes | 1,255 |
| 30-34 minutes | 2,755 |
| 35-39 minutes | 322 |
| 40-44 minutes | 748 |
| 45-59 minutes | 1,180 |
| 60-89 minutes | 313 |
| 90+ minutes | 159 |
| Average Travel Time | 0 |
Source: ESRI, 2023-10-17
Source: ESRI, 2023-10-17
Employees by NAICS
| Category | Number |
|---|---|
| Total Employees | 21,749 |
| Agr/Forestry/Fish/Hunt | 14 |
| Mining | 10 |
| Utilities | 6 |
| Construction | 670 |
| Manufacturing | 1,787 |
| Wholesale Trade | 381 |
| Retail Trade | 1,575 |
| Motor Veh/Parts Dealers | 99 |
| Furn & Home Furnish Str | 46 |
| Electronics & Appl Store | 24 |
| Bldg Matl/Garden Equip | 191 |
| Food & Beverage Stores | 649 |
| Health/Pers Care Stores | 125 |
| Gasoline Stations | 61 |
| Clothing/Accessory Store | 117 |
| Sports/Hobby/Book/Music | 192 |
| General Merchandise Str | 71 |
| Misc Store Retailers | 0 |
| Nonstore Retailers | 0 |
| Transportation/Warehouse | 254 |
| Information | 487 |
| Finance & Insurance | 3,507 |
| Cntrl Bank/Crdt Intrmdtn | 862 |
| Sec/Cmdty Cntrct/Oth Inv | 1,582 |
| Insur/Funds/Trusts/Other | 1,063 |
| Real Estate/Rent/Leasing | 1,262 |
| Prof/Scientific/Tech Srv | 2,412 |
| Legal Services | 849 |
| Mgmt of Comp/Enterprises | 16 |
| Admin/Support/Waste Mgmt | 618 |
| Educational Services | 1,220 |
| HealthCare/Social Assist | 3,425 |
| Arts/Entertainment/Rec | 325 |
| Accommodation/Food Srvcs | 1,804 |
| Accommodation | 286 |
| Food Srv/Drinking Places | 1,518 |
| Other Srv excl Pub Admin | 1,149 |
| Auto Repair/Maintenance | 85 |
| Public Administration Emp | 674 |
Source: ESRI, 2023-10-17
Educational Attainment (25+)
| Lake Oswego, OR | 2023 |
|---|---|
| Some High School | 244 |
| Graduated High School | 1,447 |
| Associates Degree | 1,751 |
| Bachelor's Degree | 13,028 |
| Graduate Degree | 10,227 |
Source: ESRI, 2023-10-17
Back To TopBusinesses
Businesses by NAICS
| Category | Number |
|---|---|
| Total Businesses | 2,306 |
| Agr/Forestry/Fish/Hunt Bus | 5 |
| Mining Bus | 1 |
| Utilities Bus | 2 |
| Construction Bus | 95 |
| Manufacturing Bus | 63 |
| Wholesale Trade Bus | 59 |
| Retail Trade Bus | 173 |
| Motor Veh/Parts Dealers Bus | 8 |
| Furn & Home Furnish Str Bus | 7 |
| Electronics & Appl Store Bus | 9 |
| Bldg Matl/Garden Equip Bus | 27 |
| Food & Beverage Stores Bus | 26 |
| Health/Pers Care Stores Bus | 17 |
| Gasoline Stations Bus | 6 |
| Clothing/Accessory Store Bus | 24 |
| Sports/Hobby/Book/Music Bus | 32 |
| General Merchandise Str Bus | 17 |
| Misc Store Retailers Bus | 0 |
| Nonstore Retailers Bus | 0 |
| Transportation/Warehouse Bus | 19 |
| Information Bus | 36 |
| Finance & Insurance Bus | 314 |
| Cntrl Bank/Crdt Intrmdtn Bus | 87 |
| Sec/Cmdty Cntrct/Oth Inv Bus | 142 |
| Insur/Funds/Trusts/Other Bus | 85 |
| Real Estate/Rent/Leasing Bus | 180 |
| Prof/Scientific/Tech Srv Bus | 324 |
| Legal Services Bus | 103 |
| Mgmt of Comp/Enterprises Bus | 6 |
| Admin/Support/Waste Mgmt Bus | 71 |
| Educational Services Bus | 66 |
| HealthCare/Social Assist Bus | 216 |
| Arts/Entertainment/Rec Bus | 50 |
| Accommodation/Food Srvcs Bus | 128 |
| Accommodation Bus | 9 |
| Food Srv/Drinking Places Bus | 119 |
| Other Srv excl Pub Admin Bus | 173 |
| Auto Repair/Maintenance Bus | 12 |
| Public Administration Bus | 31 |
Source: ESRI, 2023-10-17
Back To Top